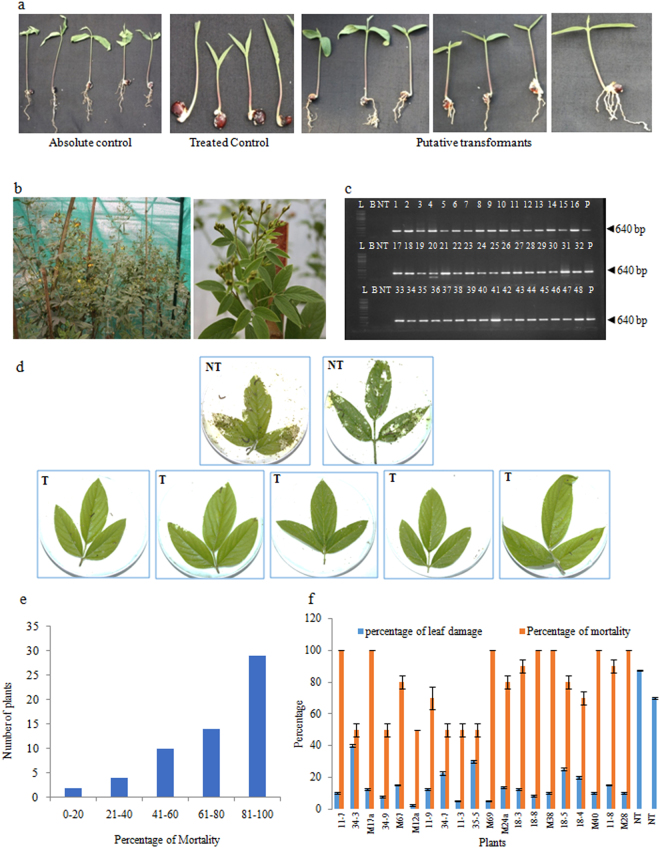
Figure 1.
Analysis of T1 generation plants. (a) Screening for the selection of putative transformants grown in quartz sand under the selection pressure of 70 ppm kanamycin; (b) putative transgenic plants established in the greenhouse; (c) PCR analysis of T1 generation plants for the amplification of a 640 bp cry2Aa gene fragment (L: 1 kb ladder, B: template blank, NT: non transgenic, lane 1–48 = representative samples of putative transformants, P: plasmid); (d) Performance of putative transformants vis- á- vis non transgenic plants in the in vitro leaf bioassay against neonate larvae of Helicoverpa armigera (NT: non transgenic plants; T: putative transformants); (e) frequency distribution of the plants based on percentage mortality of H. armigera in the bioassay; (f) a representative histogram depicting the variation in the performance of T1 generation plants in the in vitro bioassay.

