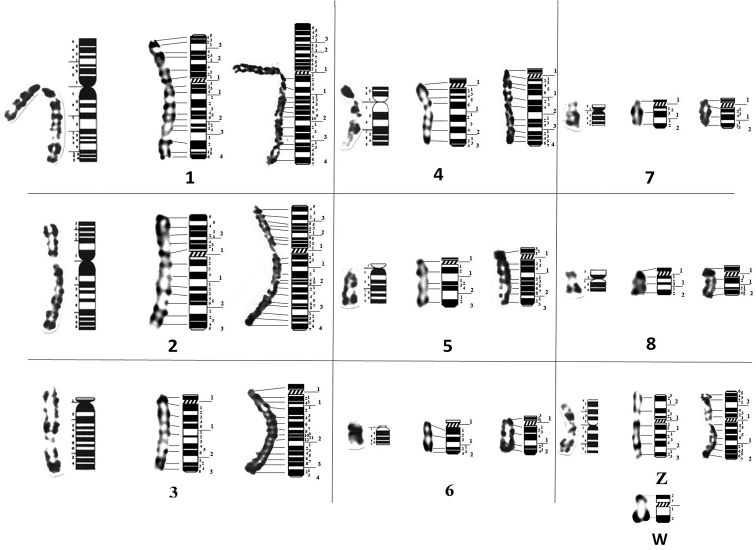
Figure 5.
RBG and RHG partial ideograms of (from left to right) G. domesticus (Ladjali-Mohammedi et al. 1999), A. barbara and A. chukar. W chromosome is represented only in A. barbara. Horizontal traits indicate correspondence of positive bands between chromosomes and ideograms. Along ideograms: Large numbers indicate regions, smallest numbers indicate positive and negative bands.

