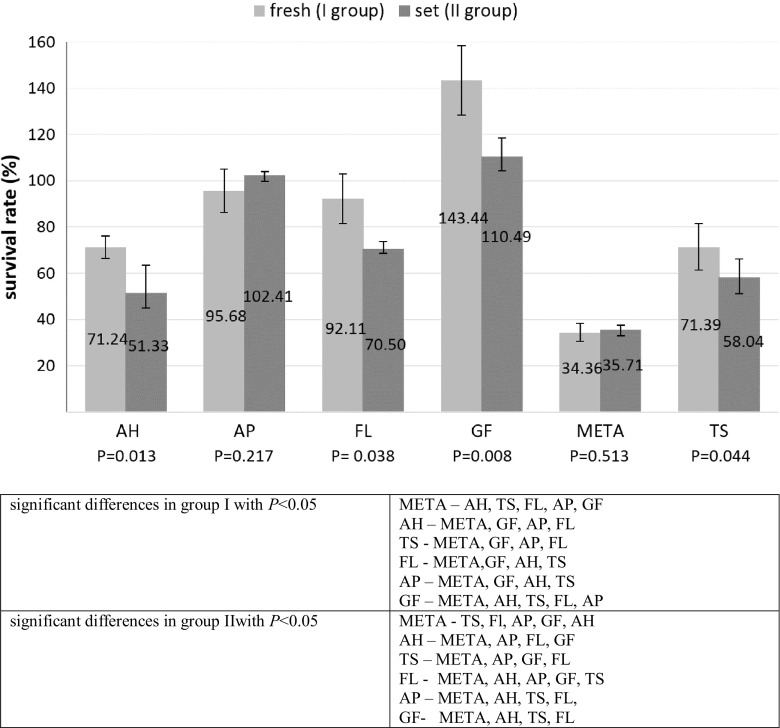
Fig. 1.
Cell viability after 24-hour exposure to fresh (I group) and set (II group) materials. Data are shown as a mean ± standard deviation. Results are expressed as a percentage of cell viability in relation to the control group. P-values placed under the graph indicate significant differences between fresh and set materials

