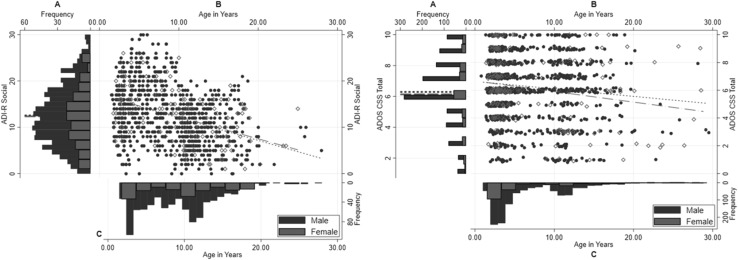
Fig. 2.
Whole sample—left panel: ADI-R Social domain current scores for males and for females, right panel: ADOS CSS Total scores for males and for females. a Distribution of scores for males (blue) and females (red), mean scores by sex presented in dashed lines; b Scatterplots of scores (Males: blue filled; Females: red hollow) with overlaid regression lines for males (blue dotted) and females (red dashed) separately; c Distribution of chronological age by sex. Note that for ease of presentation, only individuals aged up to 30 years are displayed here. (Color figure online)

