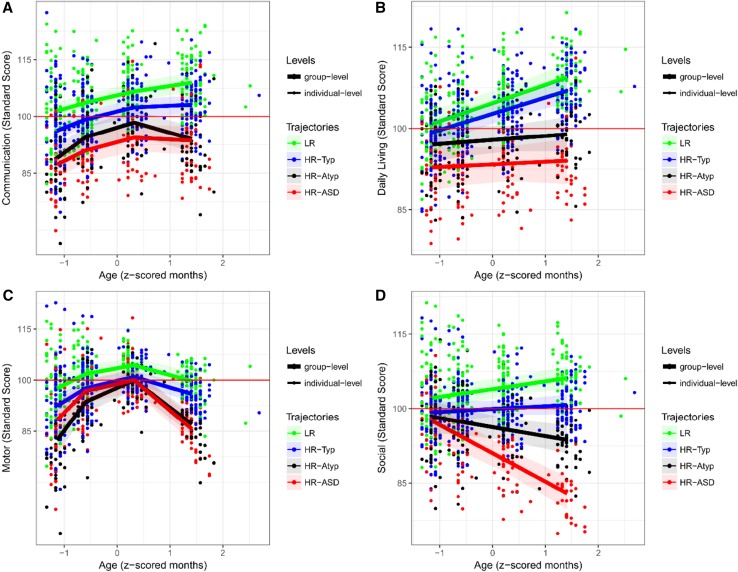
Fig. 2.
Developmental trajectories of estimated means for VABS measures by clinical outcome groups. This figure shows the longitudinal trajectory of scores per outcome groups (LR, HR-Typical, HR-Atypical, HR-ASD) obtained through multilevel mixed modelling for each scale of the VABS. The developmental trajectories are built on four time-points, one for each visit, which are approximately: 8; 14; 24; 36 months. 95% bootstrap confidence interval on group trajectories is shown as shaded area. Individual scores are also shown (points) with different colours by outcome group. The average normative score is shown by the red line. VABS Vineland Adaptive Behavior Scales, LR low-risk controls, HR high-risk siblings

