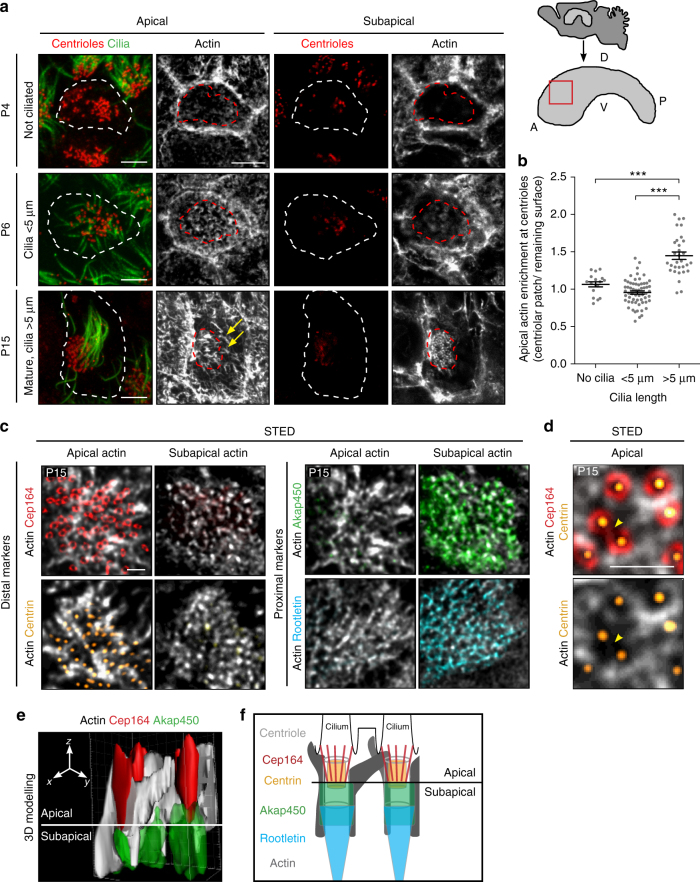
Fig. 1.
Formation of a dense actin network at the centriolar patch during ependymal cell differentiation a F-actin (phalloidin, grey), centrioles (FOP, red) and cilia (GT335, green) in whole mounts of lateral ventricular walls at postnatal days 4 (P4), P6 and P15 at the apical level (colocalising with FOP staining) and subapical level; the actin network in the centriolar patch thickens as motile cilia grow; cell borders and centriolar patches are outlined with dashed white and red lines, respectively. Arrows point to long actin filaments. On the right, a sagittal view of the lateral ventricular wall and the region of interest analysed throughout the paper (red square); A: Anterior, P: Posterior, D: Dorsal, V: Ventral. b Ratio of mean phalloidin fluorescence intensities in the centriolar patch (red dashed lines in a) and on the remaining cell surface (white minus red dashed lines) as a function of ciliary length. Error bars represent the sem of n = 112 cells from three mice; P-values were determined by one-way ANOVA followed by Dunn’s multiple comparison test; ***P ≤ 0.0001. c–e High resolution microscopy (STED) of mature ependymal cells on P15 whole-mount lateral ventricular walls. c Staining of F-actin (phalloidin, grey) and centriole distal markers, Cep164 (distal appendages, red) or Centrin2-GFP (distal lumen, yellow) that colocalise with the apical actin network, or centriole proximal markers Akap450 (pericentriolar material, green) or Rootletin (rootlets, cyan) that colocalise with the subapical actin network. d Zoom-in of Cep164 (red)-, Centrin2-GFP (yellow)- and F-actin (phalloidin, grey)-labelled mature ependymal cells; note a cluster of two centrioles with merged distal appendages (arrowhead) surrounded by actin. e Three-dimensional modelling of Cep164 (red)-, Akap450 (green)- and F-actin-(grey)-positive centrioles showing the links between the apical and subapical networks, and between neighbouring centrioles. f Model of centrioles with their associated actin bundles positioned according to the markers used in this study. Scale bars=5 μm in a and 1 μm in c, d

