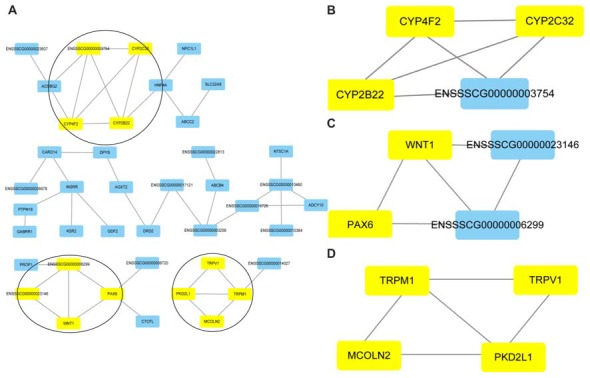
Figure 8.

Protein-protein interaction (PPI) networks and the top three clusters of differentially expressed genes. Cluster analyses were performed to screen the PPI networks using the Cytoscape molecular complex detection (MCODE) plug-in based on the STRING database. The figure illustrates the PPI networks of the DEGs based on the STRING database (A). The top three clusters identified by MCODE in the PPI network are shown, respectively (B–D).
