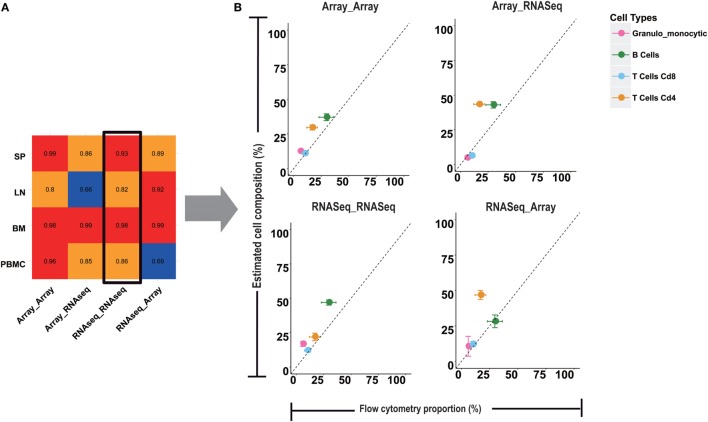
Figure 3.
Comparison of microarray and RNA-seq based deconvolution models. (A) Four cross models with microarray or RNA-seq data as the training or testing input were compared. The value in the heatmap is the Pearson correlation coefficient between the results from four computational models and flow cytometry in four tissues. (B) The error bar plots are the comparison of the RNA-seq training and testing model with the flow cytometry for granulo-monocytic cells, CD4 T cells, CD8 T cells, and B cells in peripheral blood mononuclear cell.

