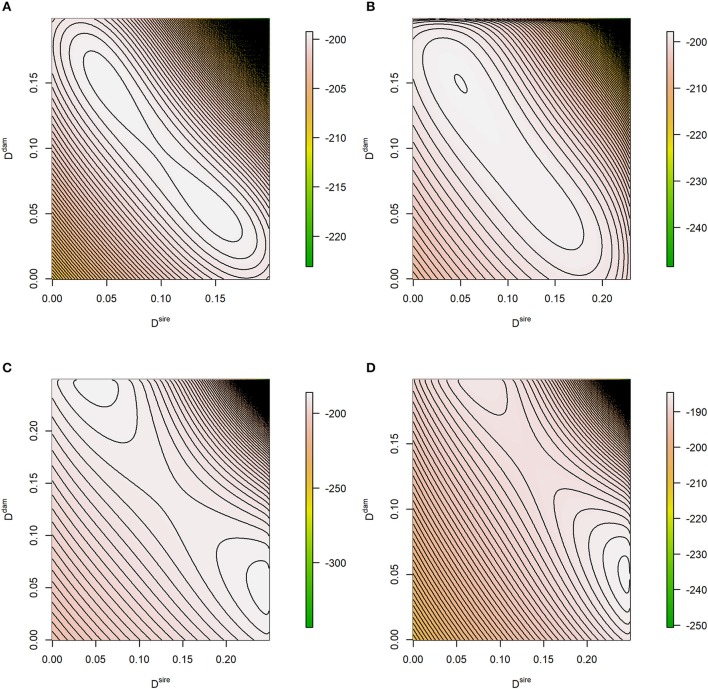
Figure 1.
Contour plot of the theoretical log-likelihood function. The true parameters of the likelihood problem were (A) p1 = p2 = 0.5, Dsire = 0.05, Ddam = 0.15; (B) p1 = 0.5, p1 = 0.4, Dsire = 0.05, Ddam = 0.15; (C) p1 = p2 = 0.5, Dsire = 0.245, Ddam = 0.05, and (D) p1 = 0.5, p1 = 0.4, Dsire = 0.245, Ddam = 0.05. Expected genotype frequencies based on the true parameters were considered, e.g., .

