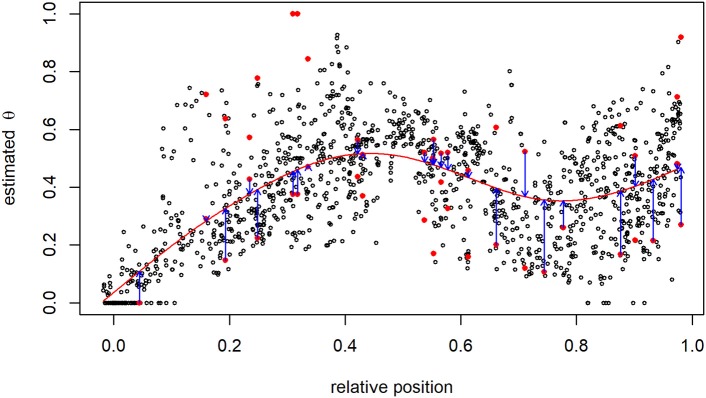
Figure 4.
Recombination rate between the 61st and all other SNPs on BTA1. The pair of proposals at SNPs with critical allele frequency are shown as red points, and smoothing via B-splines (red line) was used to identify the most suitable estimate having the smallest distance to the B-spline curve (blue arrows).

