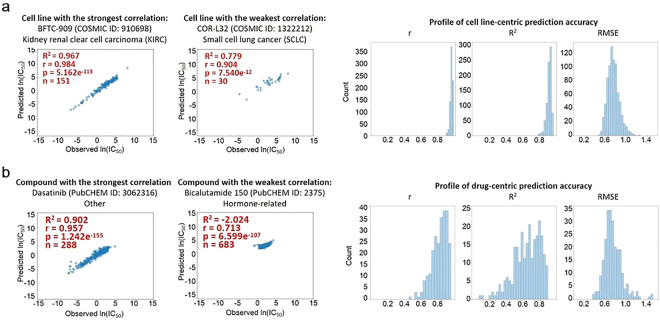
Figure 3.
Cell line- and drug-centric correlation analyses. (a) Prediction accuracy assessment for each cell line. Scatter plots show the correlation between observed and CDRscan-predicted ln(IC50) values for the cell lines that showed the strongest (BFTC-909, left) and the lowest agreement (COR-L32, right). The COSMIC IDs of the two cell lines and the corresponding cancer types are indicated above the scatter plots, and the R2 values, Pearson correlation coefficient (r), p values, and the number of instances (n) are shown in the upper left corner of each plot. Histograms on the right show the overall distribution of prediction accuracy assessed for individual cell lines using indicated metrics. (b) Scatter plots showing the strongest and weakest agreement between observed and CDRscan-predicted ln(IC50) in drug-centric correlation analysis. The drug name and its PubCHEM ID are indicated in each plot. The R2 values, Pearson correlation coefficient (r), p values, and the instance counts (n) are also indicated. Histograms on the right show the overall distribution of prediction accuracy (R2) assessed for individual drugs using indicated metrics.

