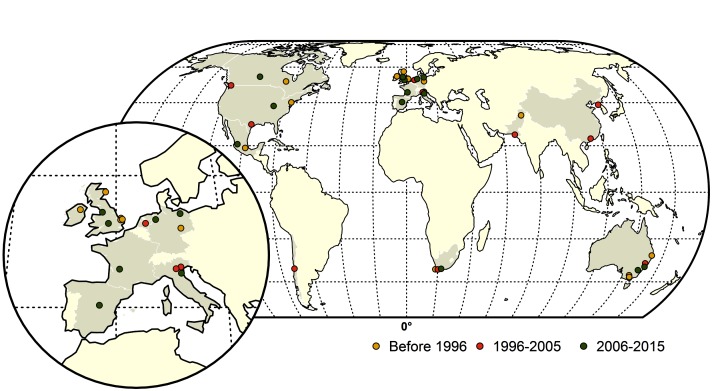
Figure 1.
Map of highly pathogenic avian influenza (HPAI) subtype H5 and H7 conversions during three time periods; yellow (before 1996), red (1996–2005) and green (2006–2015). The shapefile data used to produce these maps were made with Natural Earth (http://www.naturalearthdata.com/). The graticule is composed of a 20-degree increments and the coordinate system is Eckert IV (EPSG: 54012).

