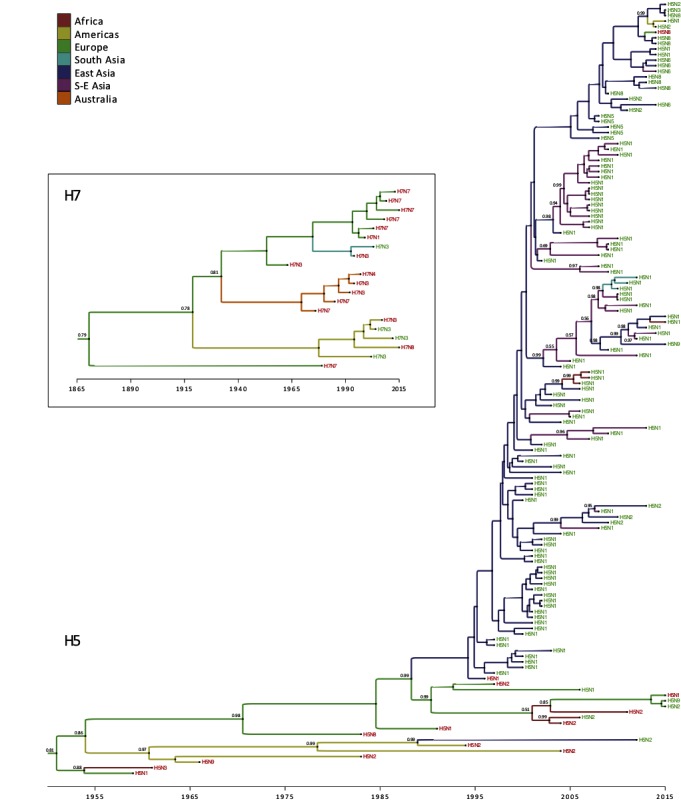
Figure 3.

Time-scaled phylogeographic history of H5 and H7 sequences associated with HPAI conversions and reassortments. Branch colors represent the most probable location of the parental node of each branch. Tip labels indicate the subtype and are colored according to the associated event, i.e., conversion (in red) or reassortment (in green). When they are lower than 0.95, posterior probabilities of the most probable ancestral state (i.e. geographic location) are reported next to internal nodes.
