Figure 7.
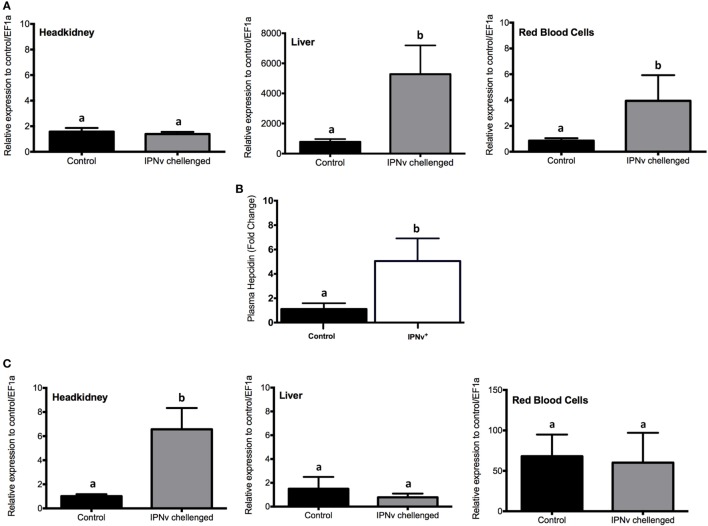
mRNA and protein expression profile of genes associated with the iron homeostatic response. Expression measured by qRT-PCR for (A) hepcidin, (C) heme oxygenase-1 from headkidney (left), Liver (middle), and red blood cells (right). (B) Plasma concentration (pg × mL−1) of Cathelicidin. The experimental groups are: virus free (Control, black bar), IPNv challenged (gray bar). Values are represented as the mean mRNA/protein abundance ± SD. Different letters denote significant differences between groups (two-way ANOVA; p < 0.05; p < 0.0001).

