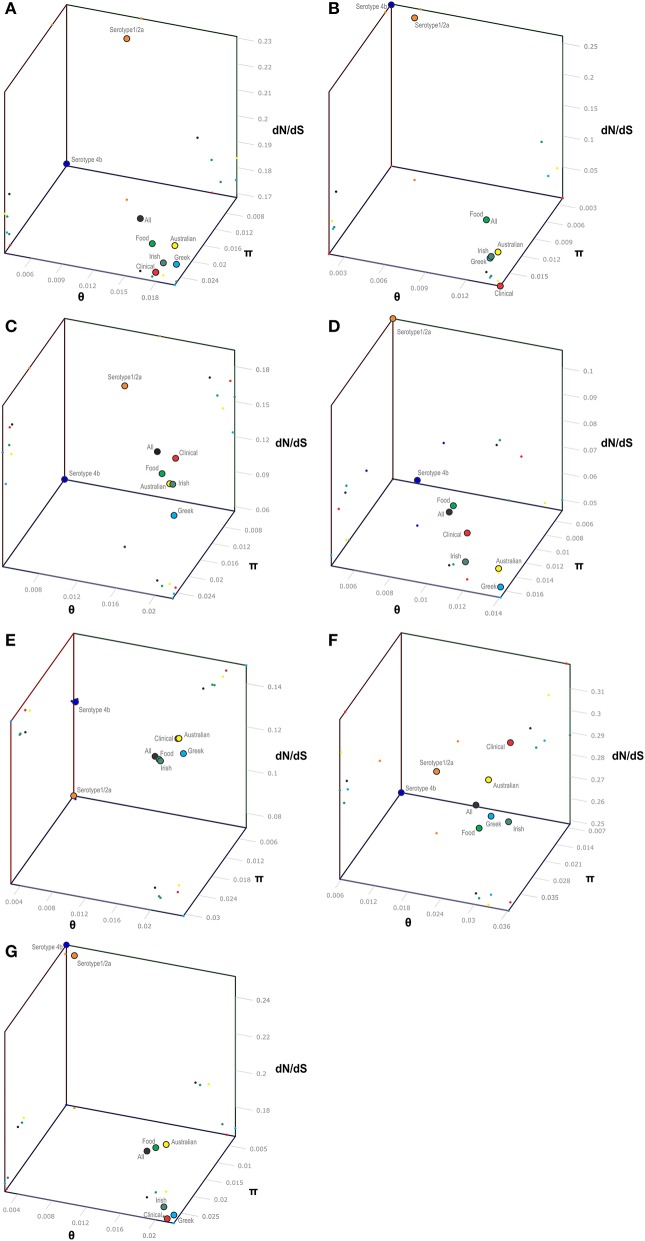
Figure 1.
3-D scatter-plot illustration of nucleotide diversity parameters (π, θ) and dN/dS ratio (ω) for the pVGC (A), prfA (B), plcA (C), hly (D), mpl (E), actA (F), and plcB (G) genes. Within each gene, colored dots represent the L. monocytogenes population grouping based on serotype (4b and 1/2a), geographical origin (Australian, Greek, and Irish strains), source of isolation (clinical or food environment), and as a whole (All strains).

