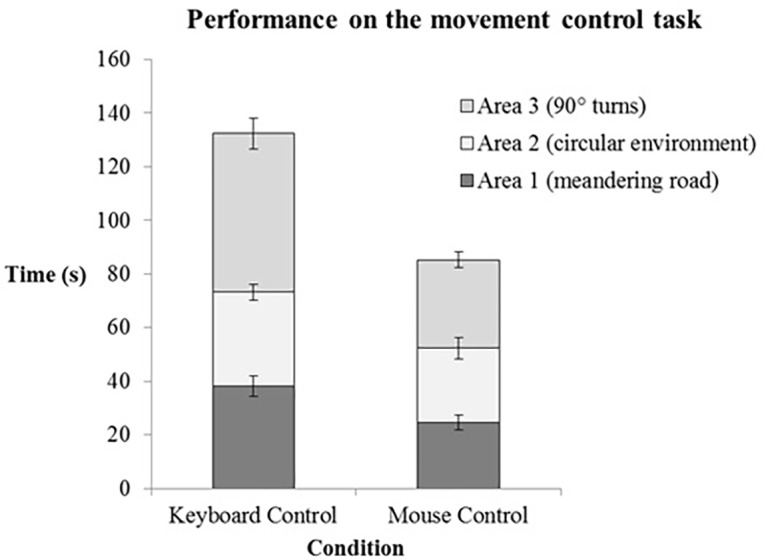
FIGURE 4.

Performance on the movement task for keyboard and mouse controlled movement (n = 29). The average time spend (seconds) in each area is indicated by the different colored stacks in the graph. The error bars represent the standard error of the mean.
