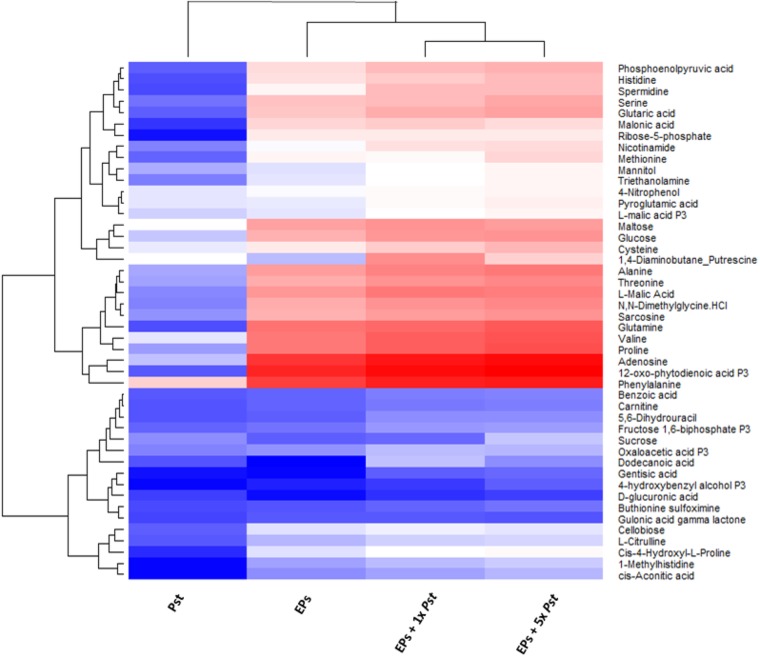
FIGURE 2.
Heat map analysis of the relative abundances of common metabolites between Pst DC3000 and Arabidopsis. The levels obtained from MaxQuant were normalized and then log10 transformed, and quantification data of metabolites identified in all the samples were presented. Blue and red denote low and high abundance, respectively. The bottom cluster contains metabolites that have similar levels in plants and bacteria.

