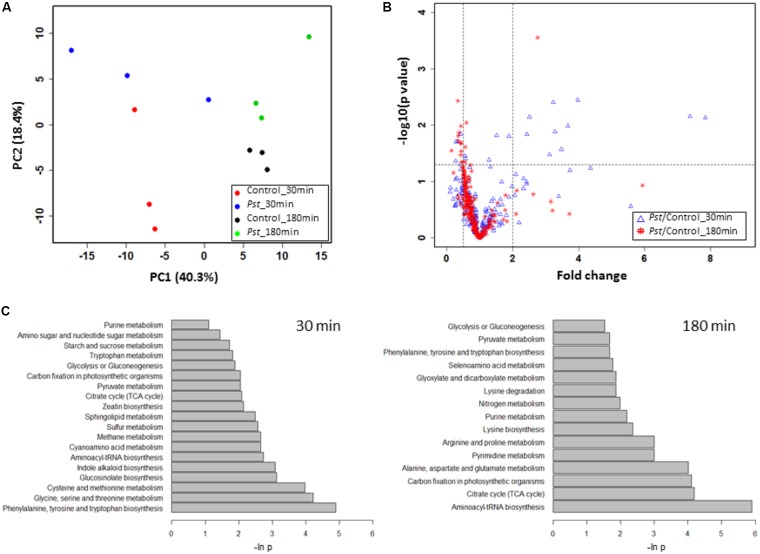
FIGURE 5.
Pst DC3000 modulation of plant metabolism. (A) PCA analysis of plant metabolites under Pst DC3000 infection. An unsupervised PCA was performed with the MRM data from four experimental groups. The first two principle components were plotted, and the percentages of variance explained by each of them were labeled on the respective axes. (B) Significantly changed metabolites under Pst DC3000 infection. The horizontal dash line denoted –log10 of the significance cutoff (p = 0.05), and the two vertical dashed lines denoted 0.5 and 2 as the cut off thresholds for fold change, respectively. (C) Pathway analysis of plant metabolites in response to Pst DC3000 infection. Enriched pathways were shown at 30 min (left) and 180 min after incubation (right).

