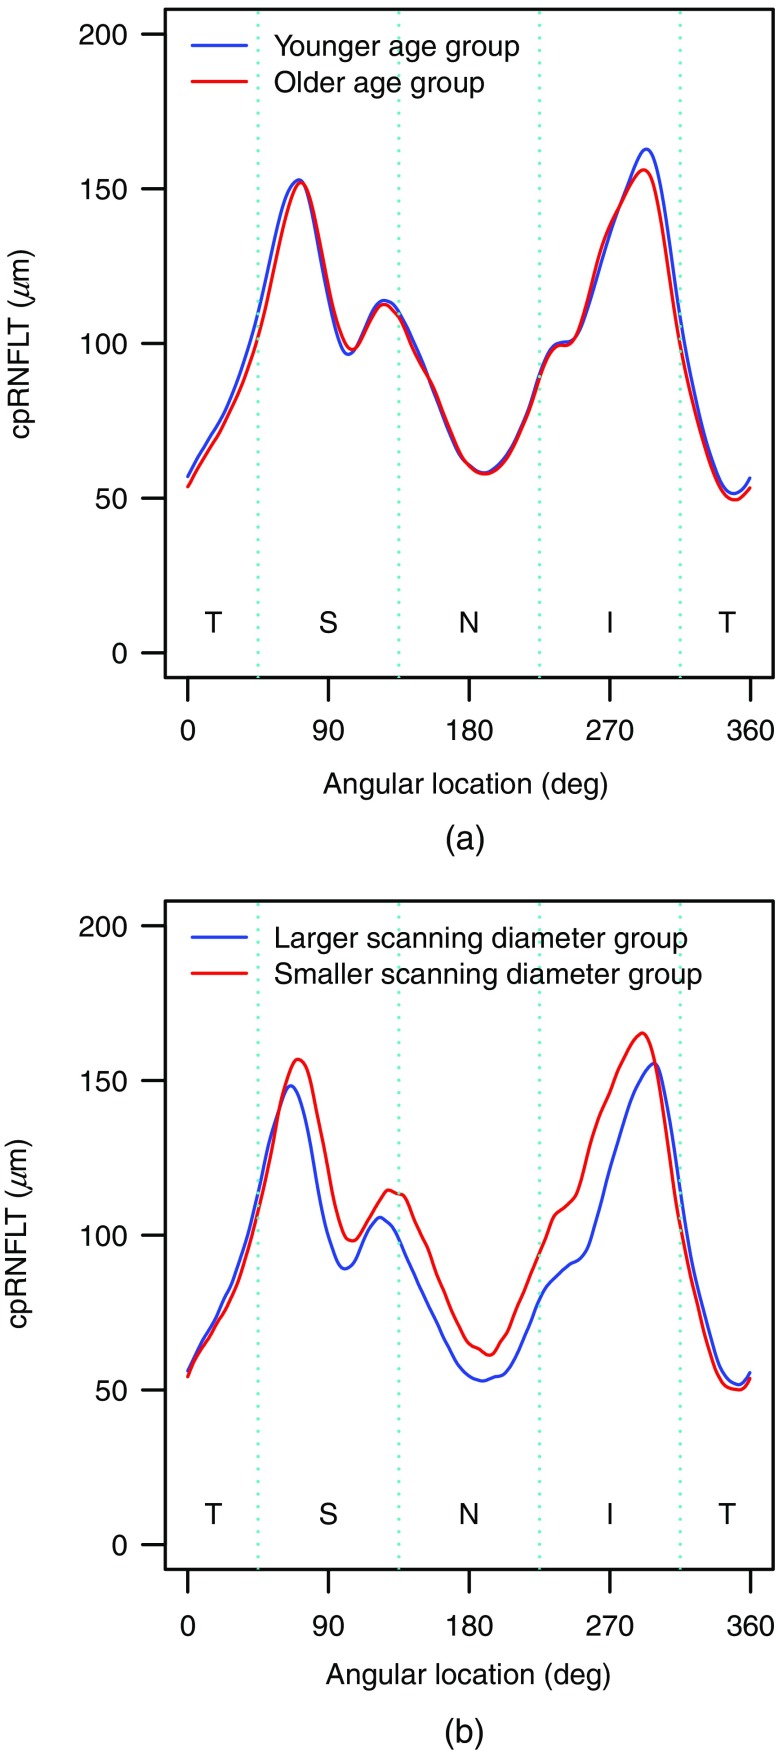
Fig. 3.
The spatial profile of the mean cpRNFLT for (a) younger (454 subjects between 35 and 45 years) and older (555 subjects between 55 and 65 years) age groups for subjects with 3.5 mm scan diameter and (b) larger () and smaller () scan diameter groups for subjects under 42.1 years, respectively.

