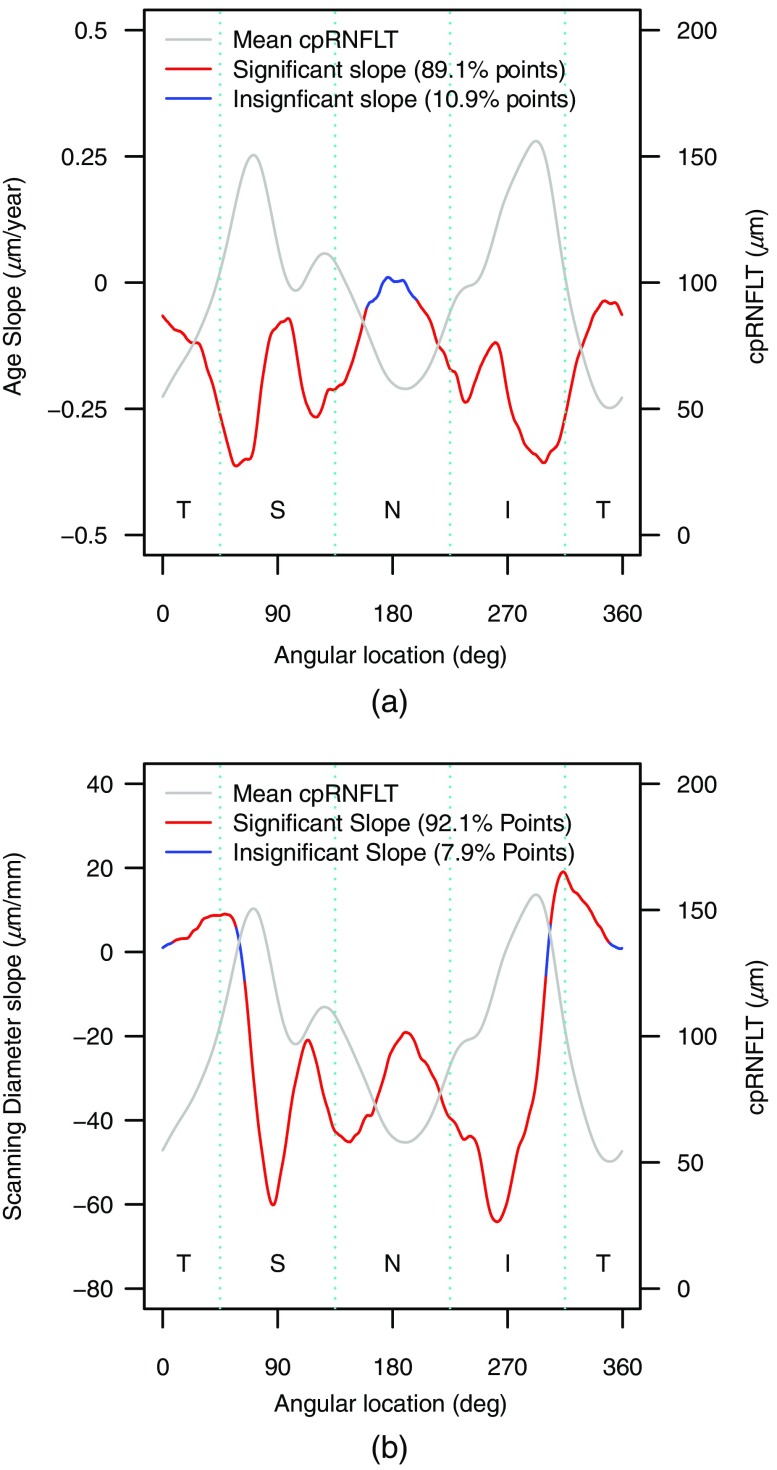
Fig. 4.
The spatial profile of (a) age slope and (b) scan diameter slope to predict cpRNFLT in comparison to the spatial profile of mean cpRNFLT for all subjects. This figure is the visualization of our pointwise cpRNFLT model based on age and scan diameter, which is described in detail in Table 4 in the Appendix.

