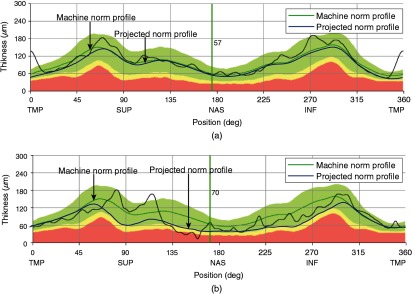
Fig. 5.
The spatial profile of age-specific cpRNFLT norms for (a) a 47-year-old subject with 3.5-mm scan diameter and (b) a 75-year-old subject with 4.4-mm scan diameter. For this graphical comparison, our projected norms (thick blue lines) were overlaid on the printouts of the two example participants. The thin black lines denote the actual measurement values of the subjects and are ignored here. Instead, our comparison focuses on the dark green lines, which denote the medians of the machine norms for these two ages.

