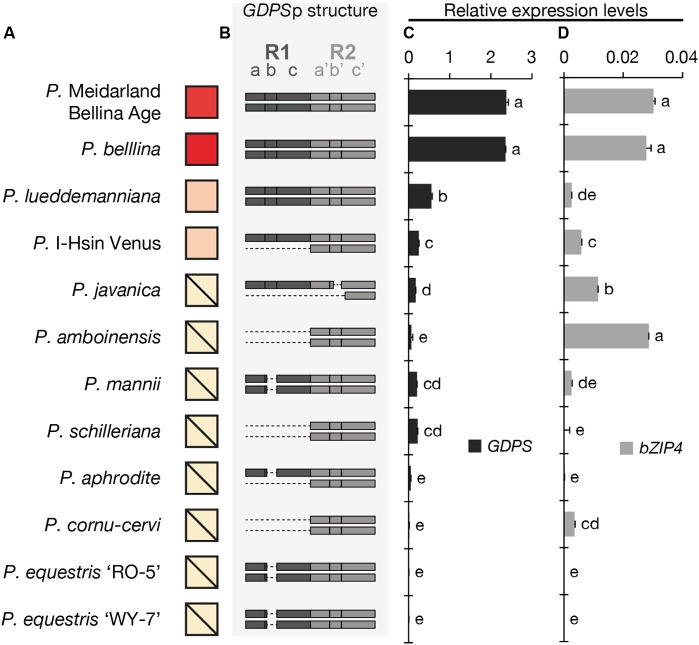
FIGURE 2.
The analysis of the floral volatiles, dual-repeat and gene expression in 12 Phalaenopsis orchids. (A) The relative amounts of floral volatiles were represented by a red color gradient. The block with a diagonal line indicates that no monoterpenoid is identified in this orchid. (B) The dual repeat structure of GDPS promoter. (C,D) The expression levels of GDPS (C), and bZIP4 (D). Expression level was normalized to that of PbActin1 by real-time RT-PCR. Data are mean ± SE from triplicate measurements. Statistic tests were performed by using Tukey’s honestly significant difference test at α = 0.05.

