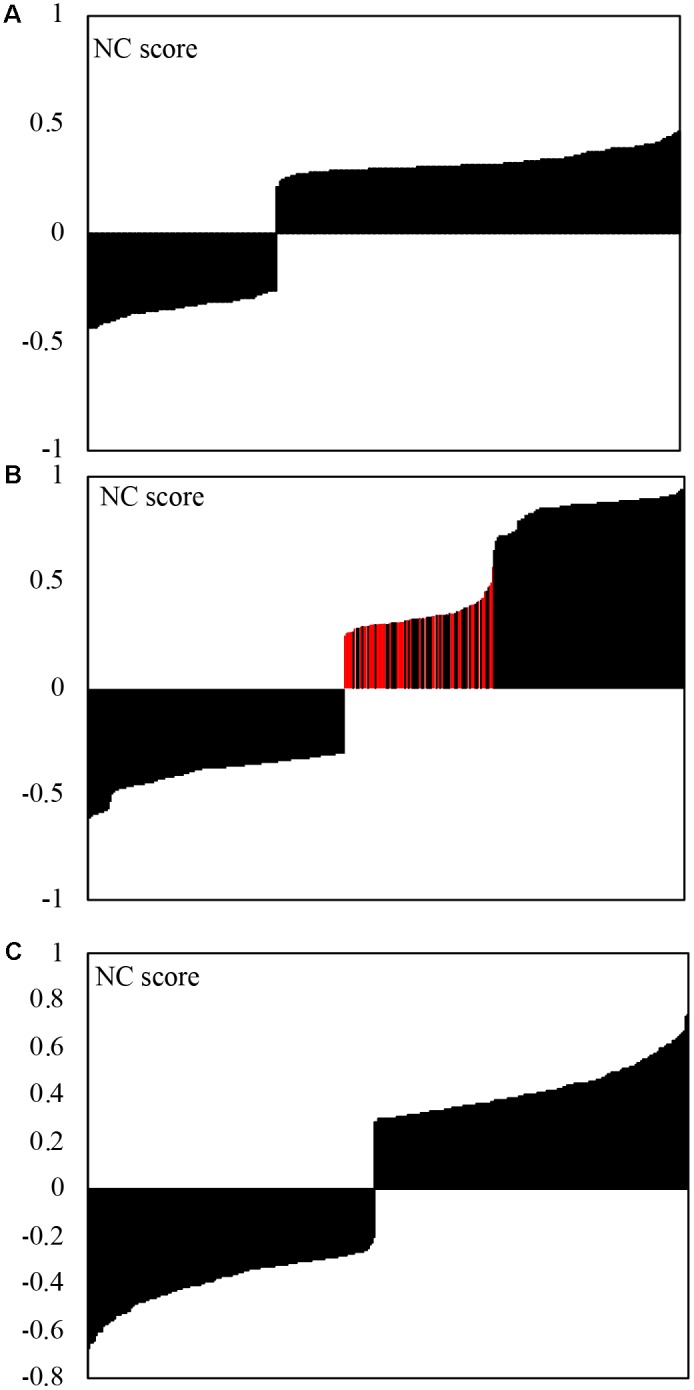
FIGURE 4.

Strength of correlation (NS-score) obtained by analysis of correlations between microbial genera using the CCREPE (Compositionality Corrected by REnormalization and PErmutation) R package. p-value Bonferroni cut-off was used to select strong correlations. Negative NS scores represent negative correlations. (A) Inter-kingdom (211) correlations; (B) Eukaryotic (375) correlations, red bars represent positive fungal/fungal and fungal/protists correlations; (C) Bacterial (422) correlations.
