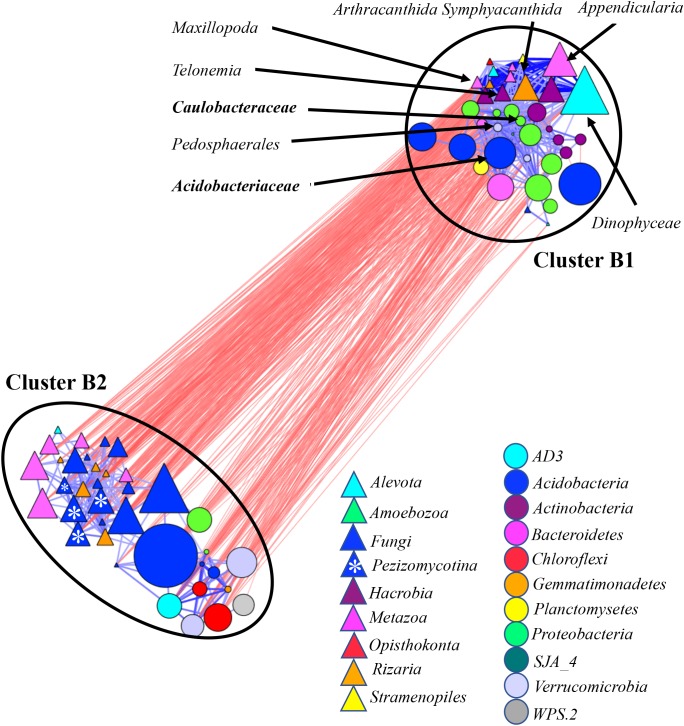
FIGURE 5.
Co-occurrence network generated by measuring abundance co-correlation between microbial taxa from root and rhizosphere and bulk soil. Correlation base network analysis showing potential interactions between bacterial, fungal, and protists genera. The size of the node is proportional to a taxon’s average relative abundance across all the samples. The lines connecting nodes (edges) represent positive (blue) or negative (red) co-occurrence relationship. The intensity of the color and the length of the edges represent the strength of correlation. The taxa shown in the figure are hub taxa, which were identified as those that were significantly more central based on the measurements of degree, betweenness centrality and closeness centrality (p > 0.1 based on normal distribution fit). The taxa in bold were found as hub taxa at least in two co-occurrence networks base on the abundances of microorganisms grouped at the genus, family or order levels.

