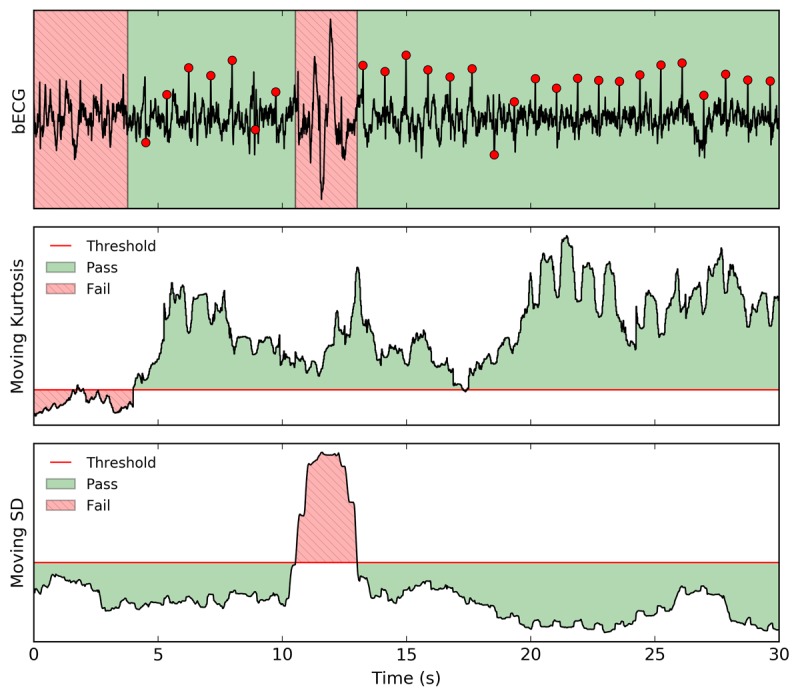
Figure 2.

Signal quality is calculated from the bandpass filtered (1-45 Hz) and notch filtered (60 Hz) bECG (top) using a moving kurtosis (middle) and moving SD (bottom). The first signal quality index (moving kurtosis) rejects regions with in-band noise that have a kurtosis below a threshold of 3.6. The second signal quality index (moving SD) rejects noisy spikes that have a moving SD greater than 1.25 times the overall SD. R-peak delineations are shown as red circles to indicate where each beat is located within regions that have passed the signal quality test. bECG: buttocks electrocardiogram.
