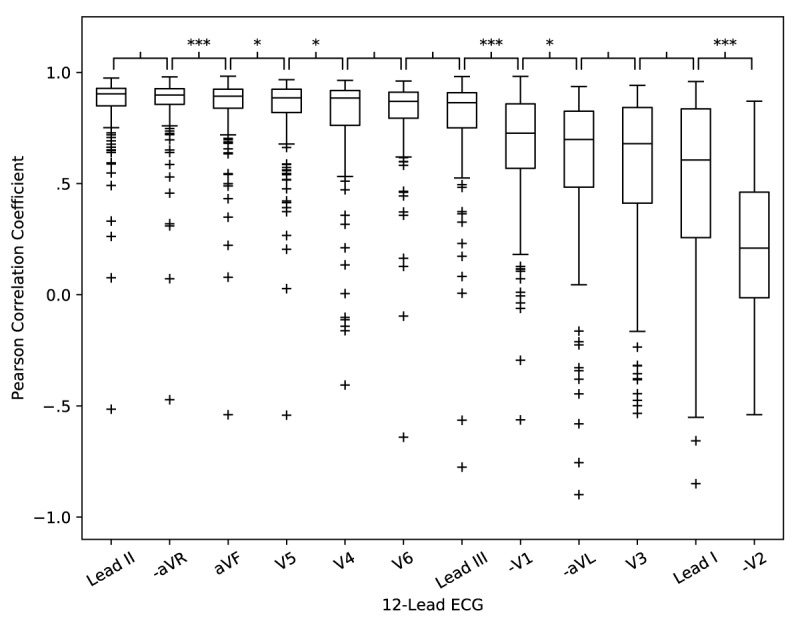
Figure 5.

Box plots across normative recordings (N=140) show the correlation between the bECG and the standard ECG leads. Leads aVR, V1, aVL, and V2 have been inverted to facilitate visual comparison. Leads are organized from left to right by highest to lowest correlation. The top 3 correlated leads were Lead II, aVR, and aVF with median correlations of .904, .899, and .893, respectively. Statistical significance was tested using a paired Student t-test (*P<.05, **P<.01, and ***P<.001). bECG: buttocks electrocardiogram, ECG: electrocardiogram.
