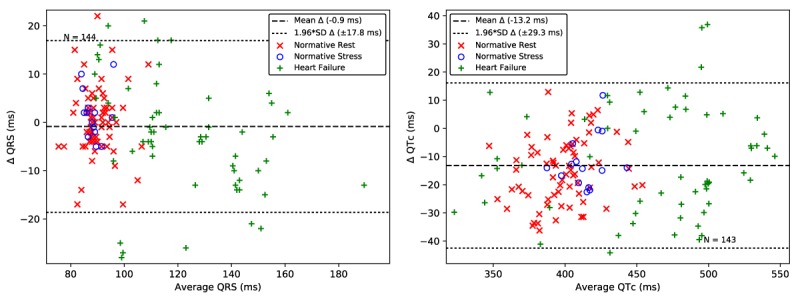
Figure 9.

QRS duration (left) and QTc interval (right) extracted from the bECG signal for normative rest (red x), normative poststress (blue o), and heart failure (green +) are closely aligned with those extracted from the gold-standard Lead II ECG. The dashed line shows the mean error. The dotted lines show 1.96 times the SD, corresponding to a 95% limits of agreement. bECG: buttocks electrocardiogram; ECG: electrocardiogram; QTc: corrected QT.
