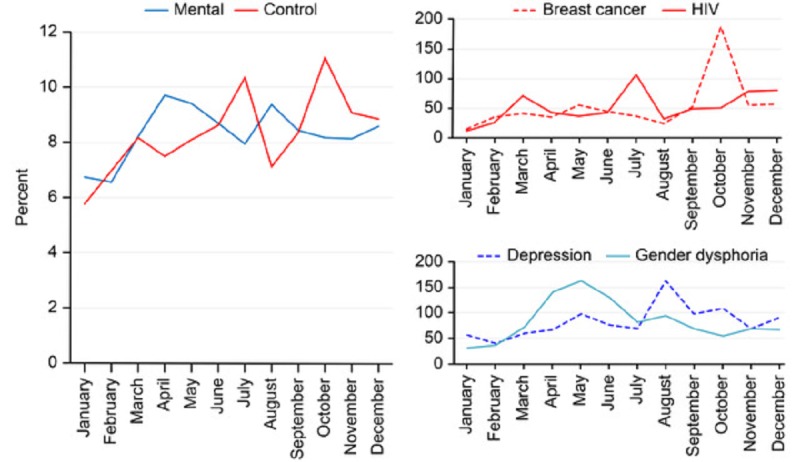
Figure 3.

Left panel: monthly distribution of the tweets sent by American mass media outlets about mental health conditions and diseases (blue solid line) and control diseases (red solid line); Y-axis: percentages were calculated with respect to the total number of tweets. Top right panel: specific analyses of breast cancer and HIV infection; Y-axis: number of tweets. Bottom right panel: specific analyses of depression and gender dysphoria; Y-axis: number of tweets or retweets.
