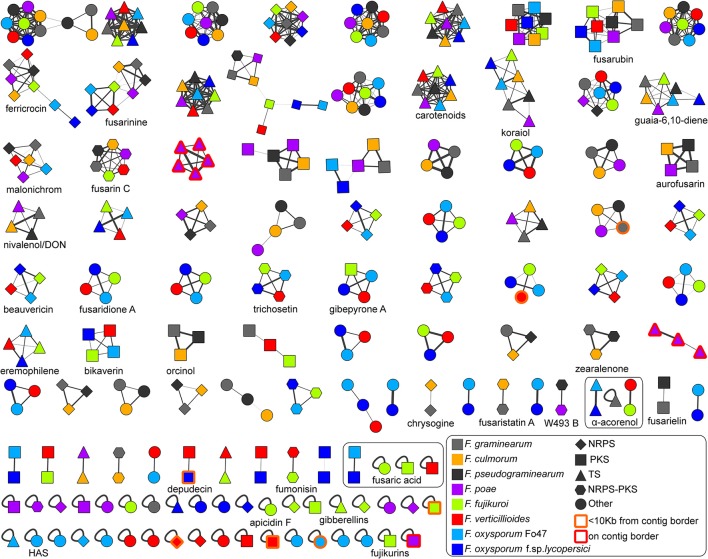
Figure 2.
Overview of the Fusarium BGC sequence similarity network. The network is displayed at a raw distance cutoff of 0.7. BGCs with known compounds used in following analyses have been marked down in the image. Node colors indicate source genomes, and node shapes indicate biosynthetic classes. The source file including raw data can be downloaded at https://git.wageningenur.nl/hooge096/MSc_Thesis/. The visualization was generated in Cytoscape v3.4.0 (Shannon et al., 2003). The koraiol synthases from F. poae studied in detail in the paper are represented by the purple-colored GCFs at the third position of the third row and at the last position of the sixth row.

