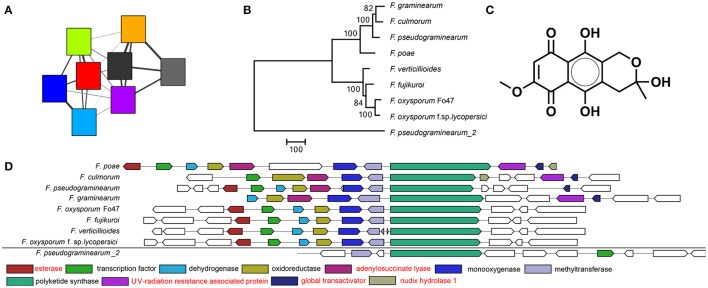
Figure 3.
The fusarubin BGC as visualized by (A) the sequence similarity network. Colors correspond to the same genomes as in Figure 2. A smaller width of the connecting lines indicates a larger raw distance between two nodes. (B) Phylogeny based on the polyketide synthase (PKS) gene shows a large distance between the PKS of F. pseudograminearum_2 and the other PKSs indicating that its BGC is indeed distantly related and probably not involved in fusarubin production. Bootstrap consensus percentages are shown at nodes in the tree. (C) Chemical structure of fusarubin (D) Multigeneblast result. The next most similar BGC immediately outside the GCF is indicated at the bottom. Genes with annotations in red are not known to be associated with fusarubin production.

