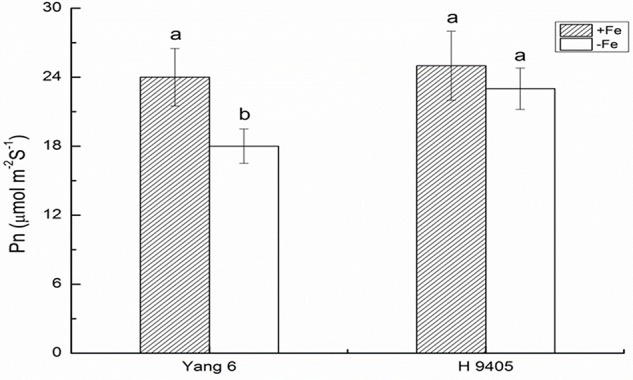
FIGURE 4.

Effects of iron deficiency on the photosynthetic rate on rice of different genotypes. Data are presented as means ± SE of three biological replicates. Significant differences among treatments are indicated by different letters as determined by Duncan’s test (P < 0.05).
