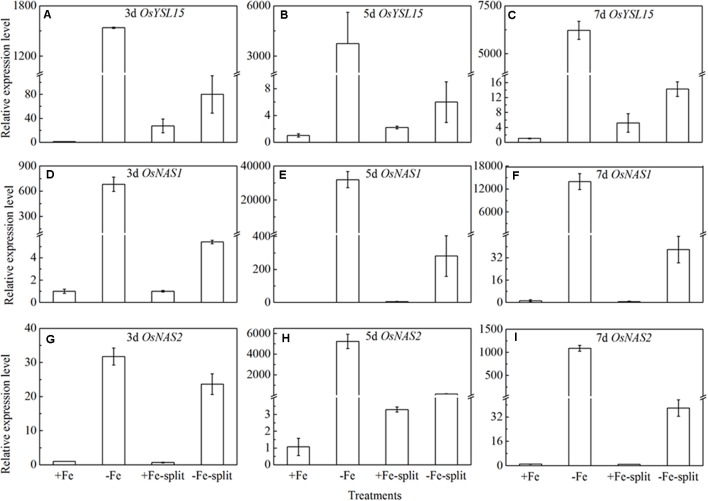
FIGURE 8.
Expression levels of OsYSL15, OsNAS1 and OsNAS2 in rice root of the split root experiment. The part labels in figures indicate the expression levels of different genes after different days (3, 5, and 7) of iron deficiency treatment. (A–C) Expression levels of OsYSL15 at 3, 5, and 7 days; (D–F) Expression levels of OsNAS1 at 3, 5, and 7 days; (G–I) Expression levels of OsNAS2 at 3, 5, and 7 days. Data are presented as means ± SE of three biological replicates.

