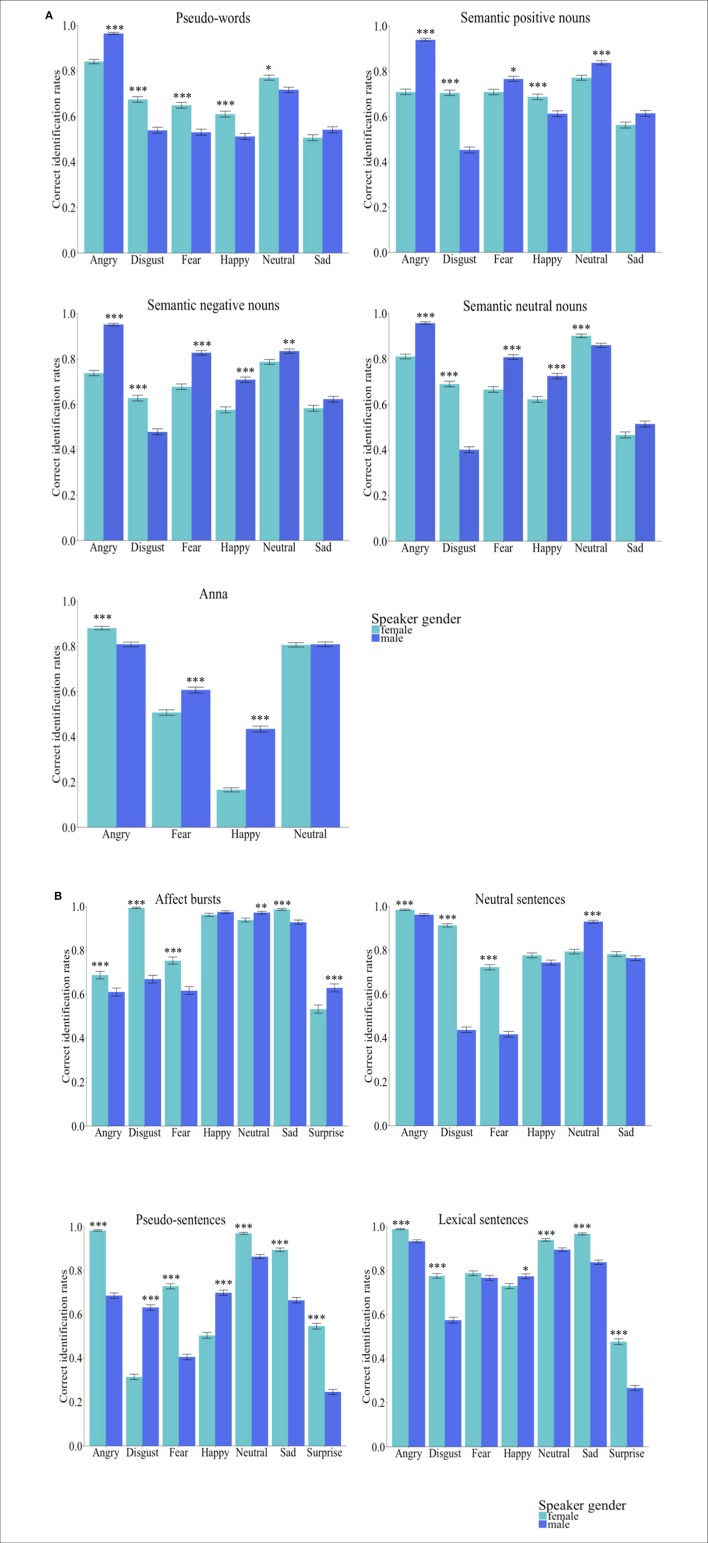
Figure 2.
(A) Group words (n = 145, 71 females). Bar charts showing the performance accuracy of identifying emotions by speakers'gender. Error bars represent the standard error. Asterisks mark the significance level: *p < 0.05, **p<0.01, ***p<0.001. As it can be observed, for the majority of emotion categories by databases, the correct identification rates were higher for emotions uttered in a male than a female voice. (B) Group sentences (n = 145, 72 females). Bar charts showing the performance accuracy of identifying emotions by speakers' gender. Error bars represent the standard error. Asterisks mark the significance level: *p < 0.05, **p < 0.01, ***p < 0.001. As it can be observed, for the majority of emotion categories by databases, the correct identification rates were higher for emotion uttered in a female than a male voice.

