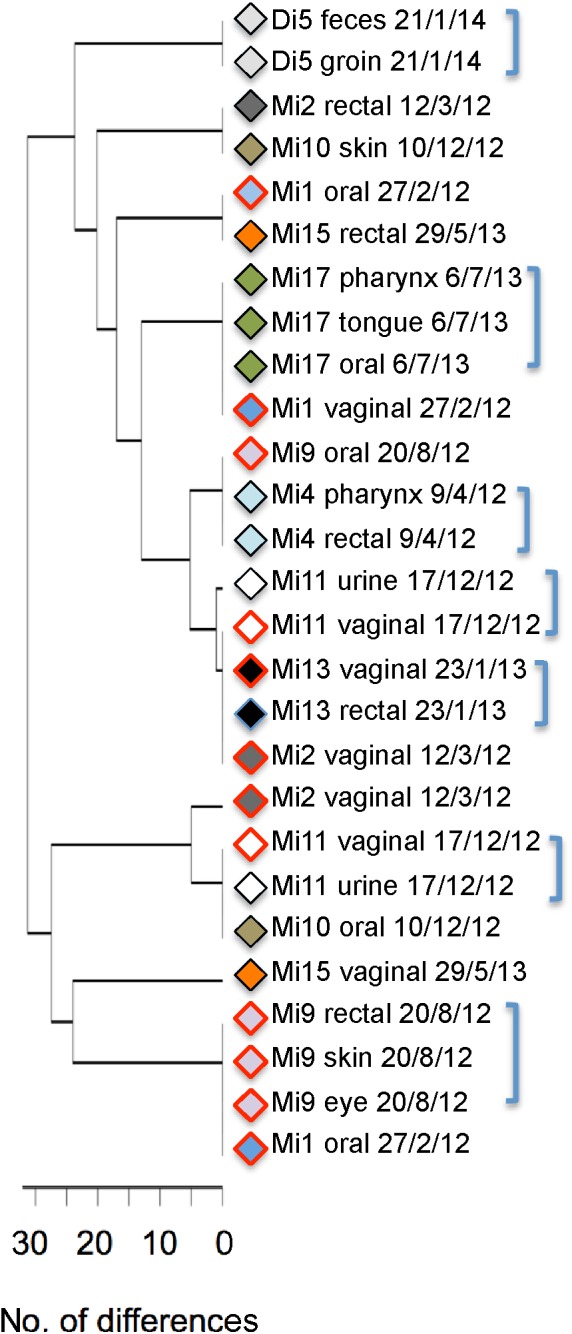
FIGURE 6.

UPGMA tree showing MLST types of isolates from 10 patients who were sampled at different sites on the same day. Isolates from the same patient are marked by a symbol of the same color. Strains from candidiasis samples are marked by red borders. Labels include patient number, sampling site and date of isolation. Brackets mark instances in which multiple isolates from the same patient have the same (or extremely similar) MLST types.
