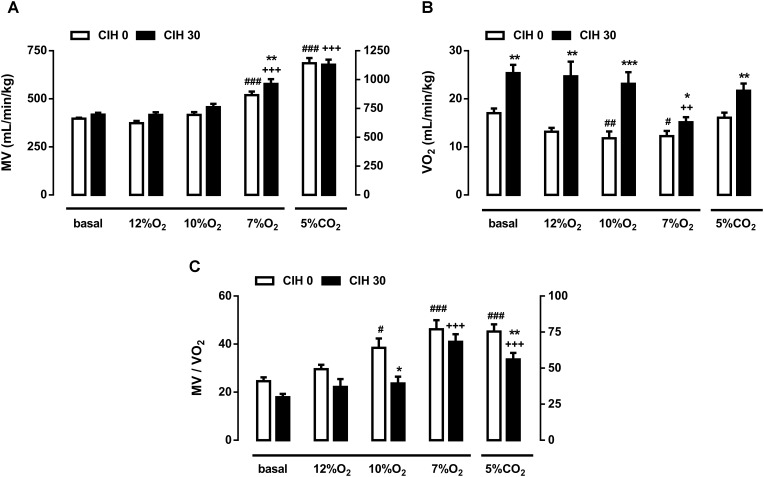
FIGURE 2.
Effect of chronic intermittent hypoxia on guinea pig ventilation. (A) Minute volume (MV; mL/min/Kg) from guinea pigs breathing air, different acute hypoxia (12% O2, 10% O2, and 7% O2) and hypercapnia (5% CO2) tests. ###p < 0.001 vs. basal CIH0; +++p < 0.001 vs. basal CIH30; ∗∗p < 0.01 CIH0 vs. CIH30. (B) Oxygen consumption (VO2; mL/min/kg) of CIH0 and CIH30 guinea pigs in response to the different gas mixtures. #p < 0.05 ##p < 0.01 vs. basal CIH0; ++p < 0.01 vs. basal CIH30; ∗∗p < 0.01 ∗∗∗p < 0.001 CIH0 vs. CIH30. (C) Normalized ventilation to oxygen consumption (MV/VO2) calculated from guinea pigs breathing under the same conditions described above. #p < 0.05; ###p < 0.001 vs. basal CIH0; +++p < 0.001 vs. basal CIH30; ∗p < 0.05 ∗∗p < 0.01 CIH0 vs. CIH30. Data are mean ± SEM; n = 16. Two-way ANOVA with Tukey’s multiple comparison test for analysis between CIH0 and CIH30 groups, and one-way ANOVA with Dunnett’s multiple comparison test for analysis intra group (vs. basal).

