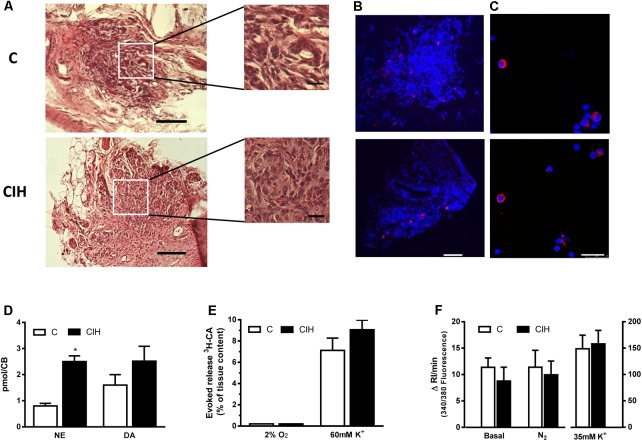
FIGURE 3.
CB morphology and stimuli-dependent response from control and CIH guinea pig. (A) Hematoxylin and eosin staining of a guinea pig CB section (control on top, CIH on bottom); calibration bar 100 μm (20 μm in inserts). (B) Immunohistochemical tyrosine hydroxylase (TH; red) and DAPI (blue) cell identification from slices of control (top) and CIH (bottom) CB; calibration bar 100 μm. (C) Immunocytochemical TH (red) and DAPI (blue) identification of isolated control (top) and CIH (bottom) guinea pig CB cells. Calibration bar 25 μm. (D) Endogenous content of norepinephrine (NE) and dopamine (DA) expressed as pmol/CB in control and CIH animals measured by HPLC-ED; ∗p < 0.05 CIH vs. C; Data are mean ± SEM (n = 8–12); Two-way ANOVA with Sidak’s multiple comparison test. (E) Evoked release of 3H-CA from control and CIH CB in response to 2%O2 or high-external K+ (60 mM). Data are mean ± SEM (n = 6); Two-way ANOVA with Sidak’s multiple comparison test. (F) Mean intracellular calcium levels, expressed as the increase in the integrated response per minute, in control and CIH chemoreceptor cells under basal conditions and in response to severe hypoxia (5% CO2/95% N2) or 35 mM K+. Data are mean ± SEM (n = 28–33); Two-way ANOVA with Sidak’s multiple comparison test.

