FIGURE 7.

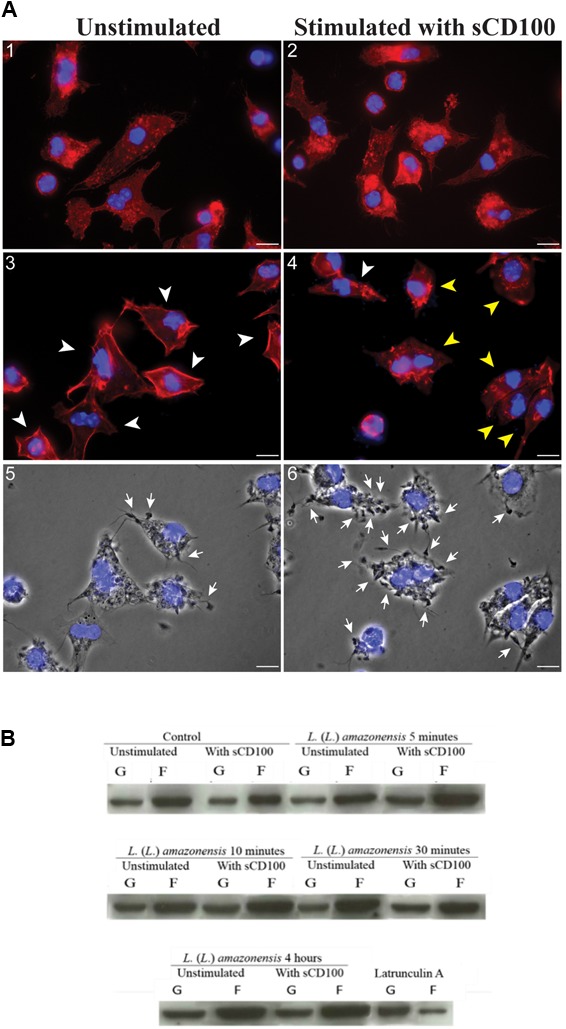
Effect of sCD100 on actin polymerization in infected and non-infected macrophages. (A) Peritoneal macrophages from BALB/c mice unstimulated (1, 3, 5) or stimulated with 200 ng/mL of sCD100 (2, 4, 6) were infected with L. (L.) amazonensis at MOI of 10 for 30 min (1, 2) or 4 h (3, 4), followed by staining with phalloidin Red: Actin (labeled with phalloidin-Texas Red), Blue: nuclear DNA and kinetoplast (DAPI). Images were captured in DMI6000B/AF6000 (Leica) fluorescence microscope coupled to a digital camera system (DFC 365 FX). White bars correspond to 10 μm. The arrowheads point to macrophages presenting cortical (white) or cytoplasmic (yellow) organization of F-actin. Contrast phase of the samples at 4 h from unstimulated and stimulated with sCD100 (5, 6). The arrows point to parasites attached to macrophages. The images are representative of two independent experiments. (B) Western blot for actin in soluble and insoluble fractions of bone marrow macrophages incubated with or without sCD100, infected or not for 5, 10, 30 min or 4 h. This representative image shows soluble actin (supernatant, G-actin), and polymerized actin (pellet, F-actin) bands, and the graph shows F/G actin ratio after densitometry. Results of a representative experiment of three with the same profile.
