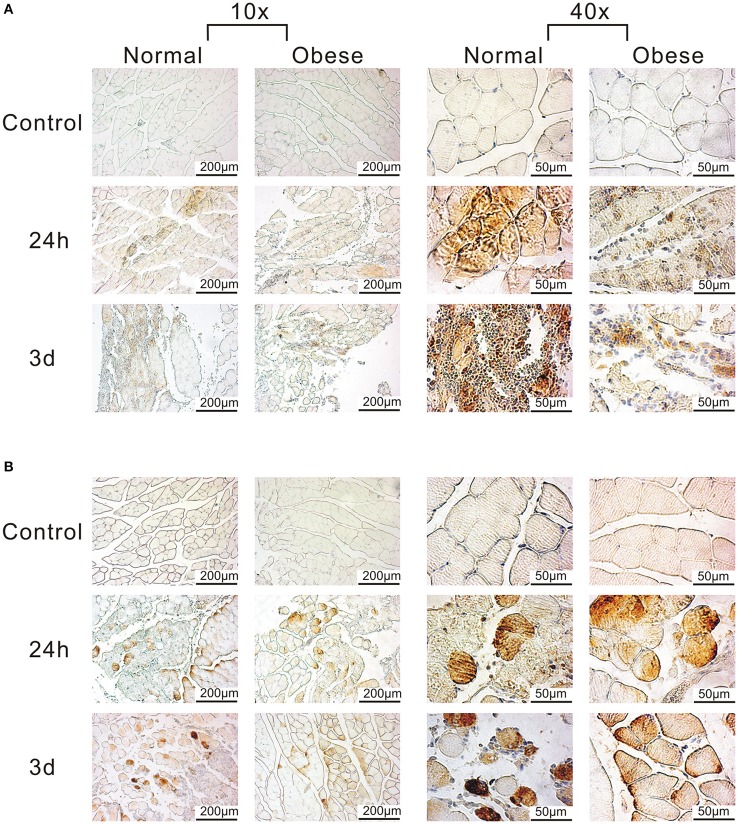
Figure 7.
Detection of C3ar and C5ar in muscle tissue of normal weight and obese mice by IHC. (A) Anti-C3ar-labeled muscle shows stronger signals for normal weight when compared to obese. (B) Anti-C5ar-labeled muscle shows a partially increased signal, and slightly increases over time, also indicating the negative role of obesity. Pictures were taken with Olympus IX81 using Xcellence v.1.2. Scale = 200 μm at 10x magnification; Scale = 50 μm at 40x magnification.

