Figure 4.

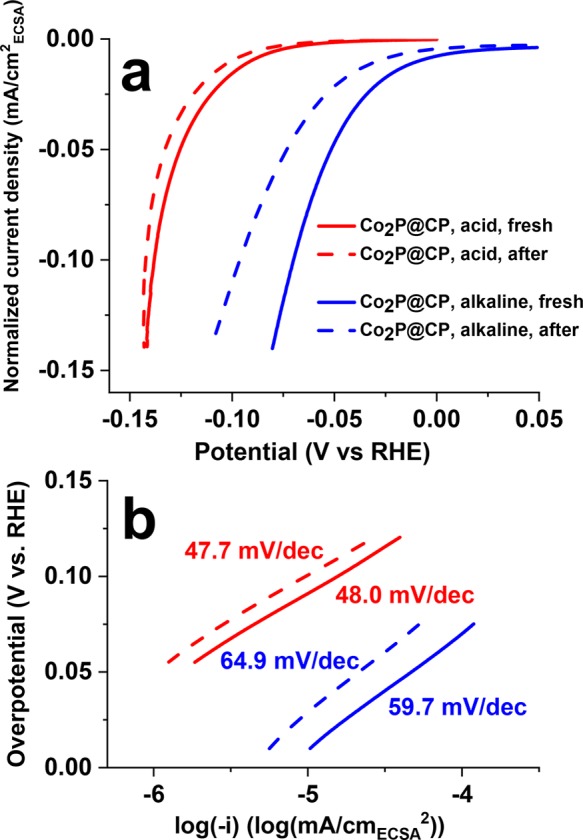
(a) Polarization curves (normalized by ECSA) of Co2P@CP before (solid lines) and after 2000 LSV sweeps (dashed lines) in 0.5 M H2SO4 and 1 M KOH; (b) corresponding Tafel plots of Co2P@CP before and after stability tests.

(a) Polarization curves (normalized by ECSA) of Co2P@CP before (solid lines) and after 2000 LSV sweeps (dashed lines) in 0.5 M H2SO4 and 1 M KOH; (b) corresponding Tafel plots of Co2P@CP before and after stability tests.