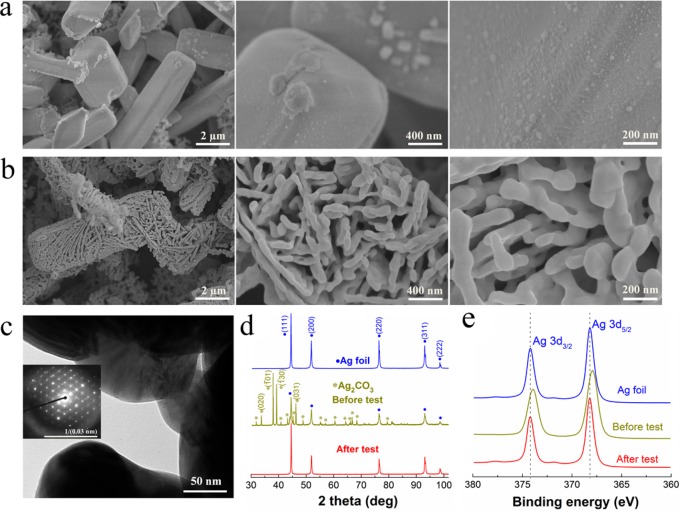
Figure 1.
SEM images of anodic-etched Ag (AE-Ag) (4.9 μm) before (a) and after (b) CO2 reduction electrolysis. (c) TEM image of AE-Ag after CO2 reduction electrolysis (the inset is the SAED pattern). (d) XRD patterns and (e) XPS spectra of untreated polycrystalline Ag (blue line) and AE-Ag before (dark yellow line) and after (red line) CO2 reduction electrolysis, respectively.

