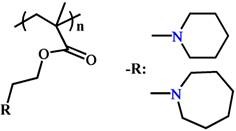
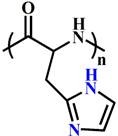
Table 1.
The typical representative pH-responsive structures in the tumoral and intracellular endo/lysosomes.
| Phase-transition | Structure (Name) | pH | Examples | |
|---|---|---|---|---|
| Tumoral acid responsive structures (pH 6.5-7.2) |
Protonation |
 (PC6A) (PC7A) |
~ 7.2 ~ 6.9 |
99, 106-108 |
 (PAE) |
~ 7.0 | 109-112 | ||
 (PSD) |
~ 7.0 | 113-115 | ||
 (PHis) |
~ 6.5 | 116-119 | ||
| Deprotonation |
 (PVBA) |
~ 7.1 | 120-123 | |
| Acid-labile bond |
 (DMMA) |
~ 6.8 | 53, 60, 124, 125 | |
 (Benzoic-imine) |
~ 6.5 | 126-129 | ||
| Endo/lysosome acid responsive structures (pH 4.5-6.5) |
Protonation |
 (PDPA) |
~ 6.3 | 49, 52, 64, 77, 130 |
 (P4VP) |
~ 5.6 | 131-134 | ||
 (P2VP) |
~ 5.0 | 135-137 | ||
| Deprotonation |
 (PMAA) |
~ 6.3 | 138-141 | |
 (PEAA) |
~ 5.6 | 142, 143 | ||
 (PAsp) |
~ 5.0 | 144-147 | ||
| Acid-labile bond |
 (Citraconic amide) |
~ 5.5 | 55, 148-150 | |
 (Hydrazone) |
~ 6.0 | 117, 151-153 | ||
 (Imine) |
~ 6.5 | 154-157 | ||
 (β-Thiopropionate) |
~ 5.5 | 158-161 | ||
 (Ketal) |
~ 5.0 | 162-165 | ||
 (Acetal) |
~ 5.0 | 166-169 | ||
 (Cyclic acetal) |
~ 5.0 | 170-172 | ||
 (Ortho ester) |
~ 5.0 | 72, 173-176 |
