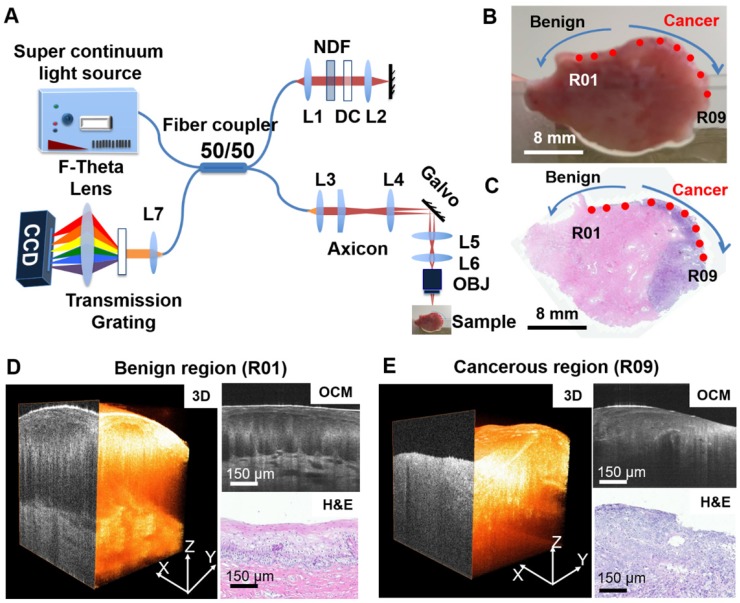
Figure 1.
Summary of OCM imaging procedures. (A) Diagram of the ultrahigh-resolution OCM imaging system used in the project. (B) Cervical specimen gross image and corresponding histology. (C) OCM imaging locations were marked on the gross tissue picture using red dots (R01 to R09). The corresponding H&E slide from the same specimen was matched to the gross picture by tissue contour and structural landmarks. OCM imaging locations were projected to the H&E slide to obtain a ground truth diagnosis for each OCM dataset. (D-E) Representative 3-D OCM images, OCM cross sections, and corresponding H&E histology of a benign region (R01, (D)) and a cancerous region (R09, (E)) from locations shown in (B) and (C).

