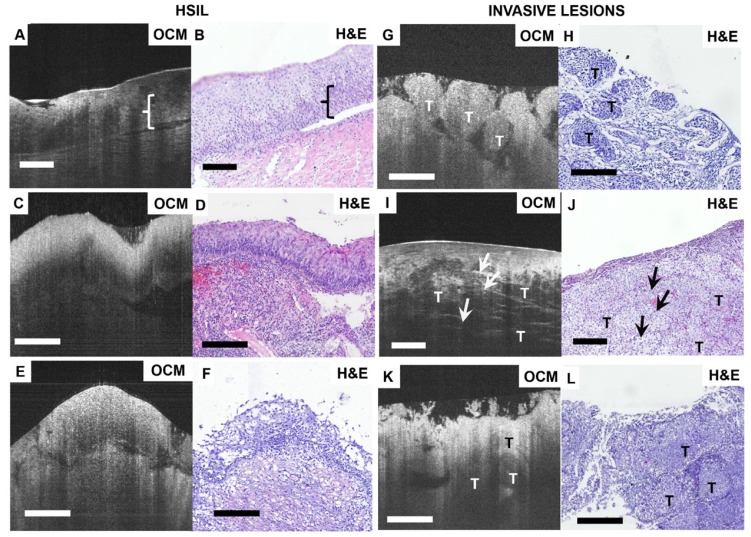
Figure 3.
Typical OCM and corresponding histology images of high-risk cervical tissues. OCM images (A, C, E) and corresponding H&E histologic sections (B, D, F) of high-grade squamous intraepithelial lesions (HSIL). The interface between the epithelium layer and stroma still can be found (A, E) but may be less clear (C). 3D OCM scan of (A) is shown in Video S6. OCM images (G, I, K) and corresponding H&E histologic sections (H, J, L) of invasive lesions. Nests ((G), 3D scan shown in Video S7), clusters ((I), 3D scan shown in Video S8) or sheets (K) of homogeneous (G) or heterogeneous regions (I, K) can be identified in the OCM images. (I) exhibits hyper-scattering desmoplastic reaction (arrows) with fibrous stroma tissue visible. OCM images of adenocarcinoma (K) share heterogeneous characteristics with squamous cancer images (G). T: tumor. Scale bars: 150 μm.

