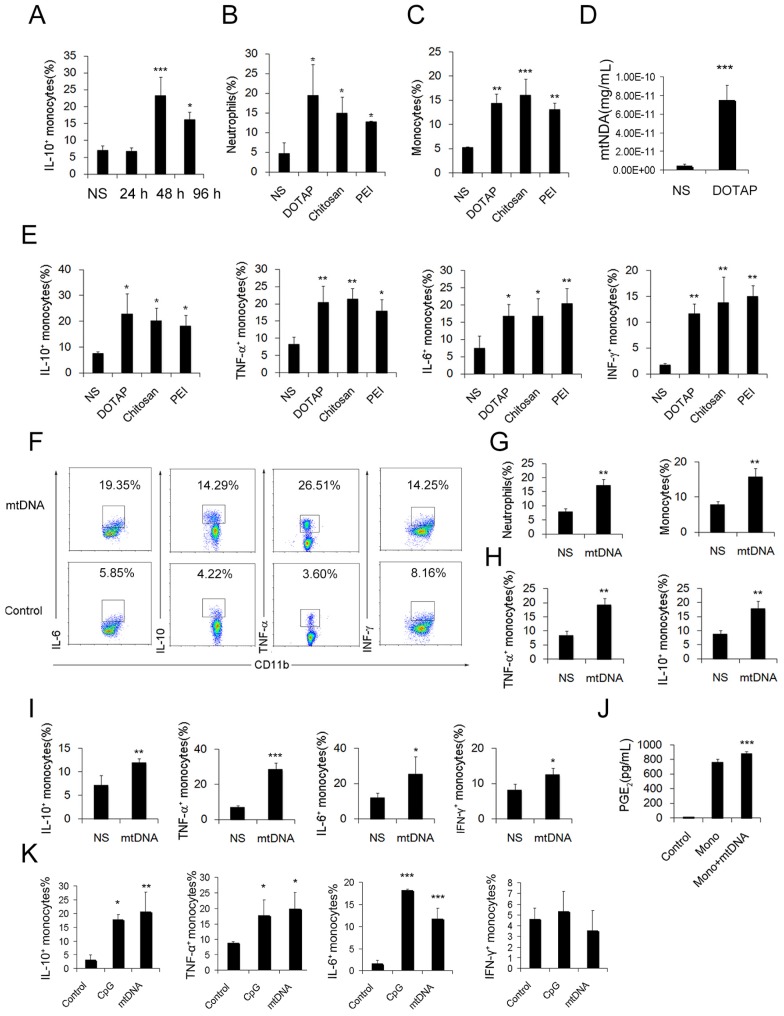
Figure 3.
Regulatory Ly6C+ inflammatory monocytes are increased in the lungs after the cationic liposome dose, and mtDNA-stimulated Ly6C+ inflammatory monocytes adopted a dual phenotype. (A) C57BL/6 mice were injected with DOTAP liposomes or normal saline as a control and were sacrificed 24, 48 or 96 h after the injection. Cells were first gated on CD45+CD11b+Ly6C+ monocytes, and intracellular cytokine staining for IL-10 was performed. (B-C, E) C57BL/6 mice were treated with DOTAP liposomes (25 mg/kg), PEI (5 mg/kg) or chitosan (25 mg/kg); 48 h after the injection, the number of neutrophils and monocytes and the intracellular levels of IL-10, TNF-α, IL-6 and IFN-γ in inflammatory monocytes were determined by flow cytometry (n=5). (D) The mtDNA level in the sera of mice treated with DOTAP liposomes was determined by qPCR at 6 h after the injection (n=3). (F) Monocytes isolated from bone marrow were cultured with mtDNA (5 μg/mL) for 4 h in the presence of 4 μg/mL brefeldin A, a Golgi-blocking agent. Intracellular cytokine staining for IL-10, TNF-α, IL-6 and IFN-γ; the cells were first gated on CD45+CD11b+Ly6C+ monocytes. (G-H) C57BL/6 mice were injected with mtDNA (5 μg/mouse) or normal saline as a control and sacrificed 48 h after injection. Flow cytometric analysis was conducted. Neutrophils and inflammatory monocytes in the lungs of the mice treated with mtDNA or normal saline; IL-10 and TNF-α expression in inflammatory monocytes (CD45+CD11b+Ly6C+) (n=4). (I) Monocytes isolated from bone marrow were stimulated with mtDNA (5 μg/mL) for 4 h in the presence of brefeldin A. Intracellular cytokine staining for IL-10, TNF-α, IL-6 and IFN-γ (n=3). (J) EIA for PGE2 in the supernatants of bone marrow monocytes cultured alone or with mtDNA for 20 h (n=3). (K) Monocytes were stimulated with mtDNA or CpG1668 in the presence of brefeldin A; intracellular cytokine staining for IL-10, TNF-α, IL-6 and IFN-γ (n=3). Data are representative of three independent experiments, and the results are expressed as the mean ± S.E.M. Statistical comparisons were performed using Student's t-test or Dunnet's t-test (*P<0.05; **P<0.01; ***P<0.005).

