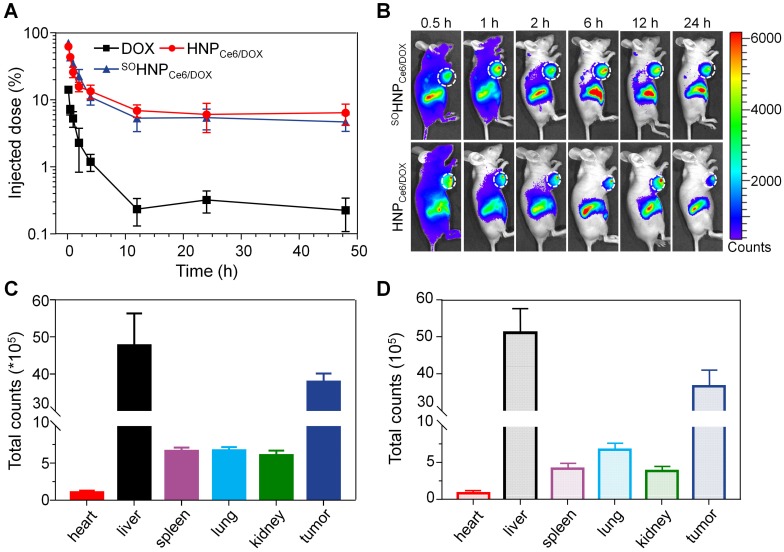
Figure 6.
(A) Pharmacokinetic profiles of DOX after intravenous administration of different DOX formulations (mean±SD, n = 4). (B) In vivo fluorescence images of the MCF-7/ADR tumor-bearing mice at 0.5, 1, 2, 6, 12 and 24 h after i.v. injection of SOHNPCe6/DOX or HNPCe6/DOX. The tumor site was circled with a white line. Semiquantitative biodistribution of SOHNPCe6/DOX (C) and HNPCe6/DOX (D) in various organs at 24 h determined by the Ce6 fluorescence intensity. The data are shown as the mean±SD.

