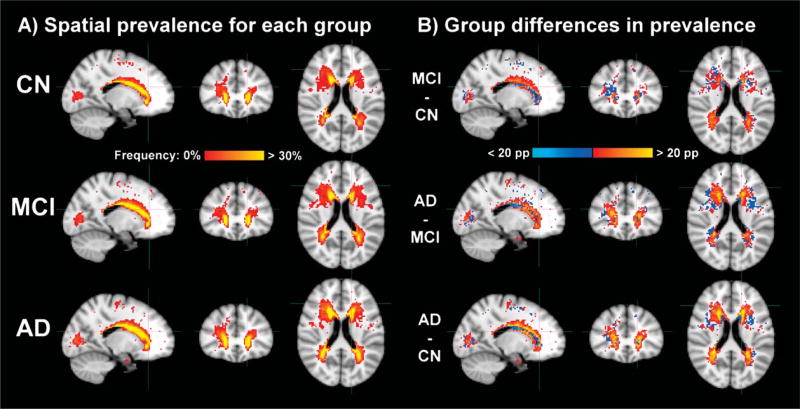
Fig. 1.
A) Spatial prevalence of WMC in controls (CN) and individuals with mild cognitive impairment (MCI) and Alzheimer’s disease (AD). Color scale varies from red to yellow, from when at least one participant has WMC to when 30% or more have WMC in a given voxel. The cap of 30% allows easier comparison of the diffuse differences between groups. B) Group differences in spatial prevalence of WMC. Color scale varies from light blue to blue for negative differences of −20 to −1 percentage points and from red to yellow for positive differences of 1 to 20 percentage points. All results are displayed in the common MNI152 space after using FSL FNIRT for proper nonlinear registration of the subcortical structures.

