
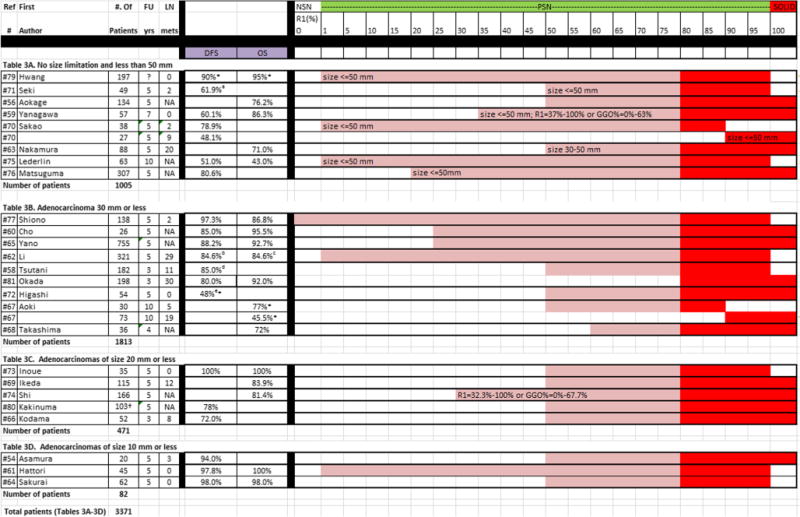
Table 3.
Publications on nodule category of PSN≥80%, listed by the different groups reported in each study. For each group, the number of patients, follow-up time, lymph node metastases, disease-free survival (DFS), overall survival (OS), and R1 (ratio of solid component to the overall nodule size) is given
|
NSN = Nonsolid nodule, defined as R1 = 0% or GGO = 100%; PSN = part-solid nodule, defined as R1 = 1-79%; SN = solid nodule, defined as R1 = 100% (alternatively R2 = 0%), and PSN≥80%
Study did not report on survival rate, rates estimated from figure.
DFS was 95.5% for p-stage IA (n = 35) and 61.9% for IB (n = 14). For calculation of median survival rates, the lowest DFS in stage IA and IB was used to provide conservative estimates.
DFS for subgroups of different path subtypes, 100% for AAH, 100% for AIS, 100% for MIA, 95.2% for LPA, 95.2% for PPA, 100% for IMA, 93.1% for MPA, 93.3% for APA and 84.6% for SPA. For calculation of median survival rates, the lowest DFS among the different subtypes was used to provide conservative estimates.
OS for subgroups of different path subtypes, 100% for AAH, 100% for AIS, 96.7% for MIA, 95.2% for LPA, 93.0% for PPA, 100% for IMA, 88.0% for MPA, 90.2% for APA and 84.6% for SPA. For calculation of median survival rates, the lowest OS among the different subtypes was used to provide conservative estimates.
DFS was 91.0% for lobectomy (n = 154) and 85.0% for segmentectomy (n = 28). For calculation of median survival rates, the lowest DFS and OS among the different types of surgery were used to provide conservative estimates.
DFS was 82% for low FDG (n = 33) and 48% for high FDG and CEA <20 (n = 21). For calculation of median survival rates, the lowest DFS in the two subgroups was used to provide conservative estimates
Numbers based on length method reported in the study. Mean 5-year relapse-free survival and mean number of patients having a GGO extent of less than 50% among seven institutions