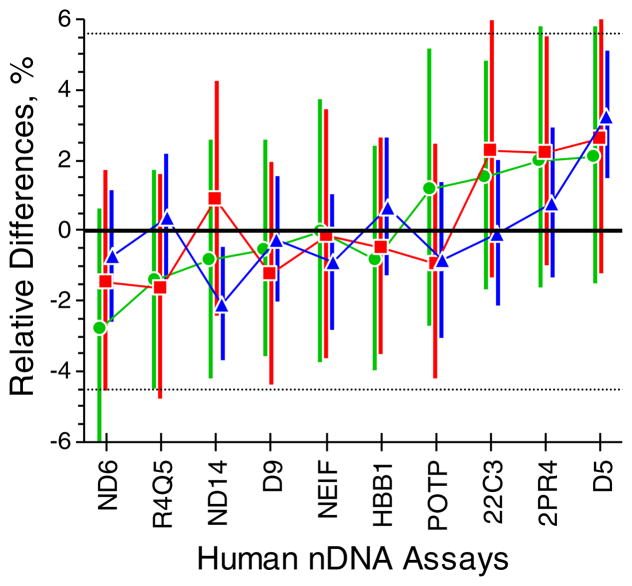
Fig. 1.
Human Genomes per Target. The “dot&bar” represent the mean relative differences among the ten assays for the three components, where the individual differences are , i indexes samples, j assays, and the “bar” above the symbol denotes averaging across replicates, plates, and (for ) assays. The solid “dots” mark the median of the posterior distribution determined by an empirical Bayesian evaluation; the vertical “bars” span the central 50%of the distribution. The green circles and lines represent the results for component “A” of the candidate CRM, red squares and lines for component “B”, and blue triangles and lines for component “C”. The thin black horizontal lines bound an approximate 95%confidence interval around the zero-difference line. See ESM Table S5 for the numerical values

