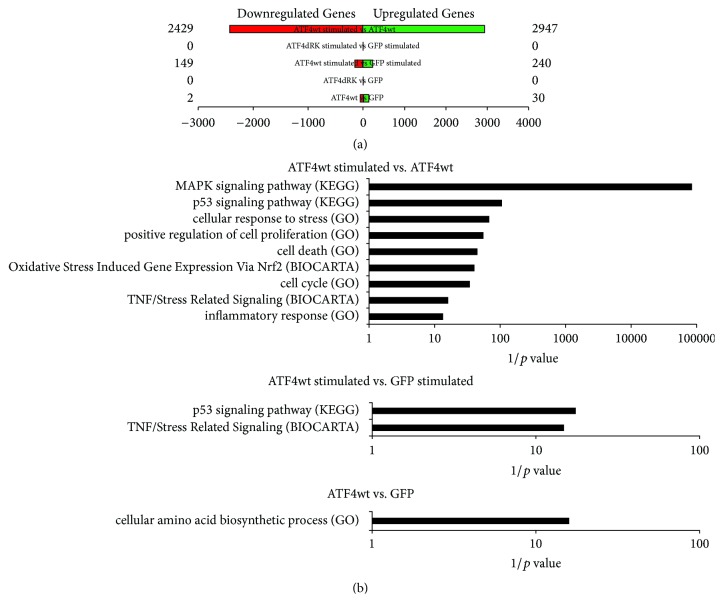
Figure 3.
Gene expression microarray analysis. (a) The number of genes compared to control (GFP) that are up- (green) and downregulated (red) in cardiomyocytes overexpressing ATF4 wild type (wt) or ATF4ΔRK with and without electrical stimulation (fold change ≥ 1.2 or ≤0.83, and p value ≤ 0.05). (b) Pathways enriched in electrically stimulated ATF4wt overexpressing HL-1 cardiomyocytes versus unstimulated ATF4wt overexpressing HL-1 cardiomyocytes (upper panel), electrically stimulated ATF4wt overexpressing cardiomyocytes versus stimulated GFP overexpressing cardiomyocytes (middle panel), and ATF4wt versus GFP overexpressing cardiomyocytes (lower panel).

