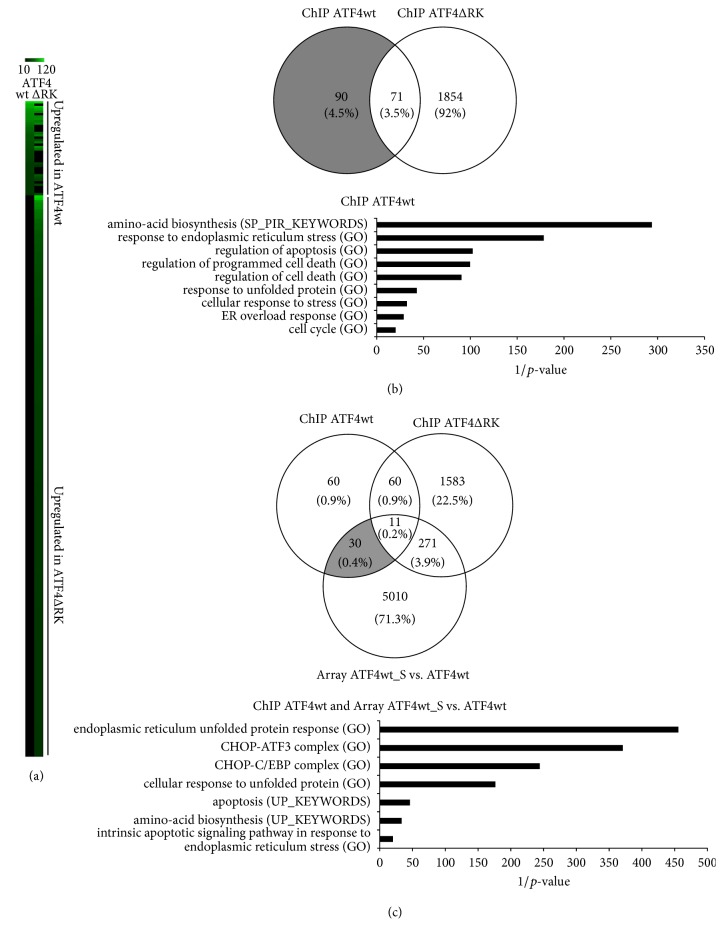
Figure 4.
ChIP-on-chip Assay. (a) Heatmap representation comparing genes with a –logp value > 10 expressed in both ATF4wt and ATF4ΔRK samples. Upregulated genes in ATF4wt and ATF4ΔRK are highlighted showing different pattern of expression. Color scale reflects expression level; black indicates no difference to control sample and green indicates increased expression compared to control. (b) Venn diagram depicting changes in genes of HL-1 cardiomyocytes overexpressing ATF4wt compared to HL-1 cardiomyocytes overexpressing ATF4ΔRK. Numbers of ATF4wt and ATF4ΔRK binding genes, with at least a fold change ≥ 1.2 or ≤0.83, and p value ≤ 0.05 compared to cells overexpressing GFP is indicated in circles (upper panel). For the grey area (genes enriched in ATF4wt but not in ATF4ΔRK), a gene ontology analysis was performed (lower panel). The main terms and pathways enriched only in the ATF4wt binding sites dataset are shown along with corresponding p values. (c) Venn diagram depicting changes in ATF4 binding genes in ATF4wt and ATF4ΔRK overexpressing cardiomyocytes in comparison to genes that are enriched in the stimulated cardiomyocytes overexpressing ATF4wt versus nonstimulated cardiomyocytes overexpressing ATF4wt microarray gene expression analysis. Numbers of genes, with at least a fold change ≥ 1.2 or ≤0.83, and p value ≤ 0.05 compared to cells overexpressing GFP are indicated in circles (upper panel). For the grey area (genes enriched in ATF4wt ChIP and stimulated cardiomyocytes overexpressing ATF4wt gene expression array only), a gene ontology analysis was performed (lower panel). The main terms and pathways are shown along with corresponding p values.

